
📊🏠 Business Overview
🎯Key Metrics
Total: 2.5/18
+2 ✅✅ Projected Operating Margin: 50.00%
+0 ⚠️ Projected 5-Year Revenue CAGR: 5.98%
+2 ✅✅ Last 5-Year ROIC: 55.60%
+1 ✅ Estimated Cost of Capital: 9.78% (lower than ROIC)
+1 ✅ Last 5-Year Shares Outstanding CAGR: -3.57%
-1 ❌ Projected 5-Year EPS CAGR: 8.25%
+0 ⚠️ Projected 5-Year Dividend CAGR: N/A
-0.5 ❌ Moody’s Rating: Ba1
-1 ❌ Morningstar Moat: Narrow
-1 ❌ Morningstar Uncertainty: High
Fair Isaac (FICO) is best known for the FICO Score, the credit score most US lenders use. It licenses the score to credit bureaus and lenders (the Scores segment, 65% of trailing revenue) and sells decision software to banks and insurers (the Software segment, 35%).
Four things matter now:
The business has been very good. Trailing revenue is up 24% year on year, mostly from higher mortgage score prices, and operating margin is 51.7% (10-Q, TTM to June 2026).
The balance sheet changed. FICO spent $3.05 billion on buybacks in nine months, funded with debt, which took total debt from $3.1 billion to $5.6 billion (10-Q).
The stock fell from about $1,660 a year ago to $711, mostly because of VantageScore, FICO’s rival. FHFA, the regulator of Fannie Mae and Freddie Mac, said on September 28, 2026 that both will price loans on a single grid for FICO and VantageScore 4.0.
On October 1, 2026, FICO committed to cut about 15% of its positions, with about $27 million of severance charges in fiscal Q4 2026 and the plan substantially complete by the end of fiscal Q3 2027. That charge is not in the TTM figures or in my core EPS.
I expect FICO to stay a very profitable, cash-generating business, but with less pricing power than it had a year ago. The market already prices much of that, and I’m not sure it prices all of it.
These are my assumptions, and each one is explained below. Use the free tools linked in each section to make your own. This isn’t investment advice: take responsibility for your own decisions.
Four things matter now:
The business has been very good. Trailing revenue is up 24% year on year, mostly from higher mortgage score prices, and operating margin is 51.7% (10-Q, TTM to June 2026).
The balance sheet changed. FICO spent $3.05 billion on buybacks in nine months, funded with debt, which took total debt from $3.1 billion to $5.6 billion (10-Q).
The stock fell from about $1,660 a year ago to $711, mostly because of VantageScore, FICO’s rival. FHFA, the regulator of Fannie Mae and Freddie Mac, said on September 28, 2026 that both will price loans on a single grid for FICO and VantageScore 4.0 (HousingWire; Motley Fool, September 29, 2026).
On October 1, 2026, FICO committed to cut about 15% of its positions, with about $27 million of severance charges in fiscal Q4 2026 and the plan substantially complete by the end of fiscal Q3 2027 (8-K, October 6, 2026). That charge is not in the TTM figures or in my core EPS.
FICO reports its fiscal Q4 in early November 2026 (the company hadn’t confirmed the date when I wrote this), so this post uses the June 2026 quarter.
I expect FICO to stay a very profitable, cash-generating business, but with less pricing power than it had a year ago. The market already prices much of that, and I’m not sure it prices all of it.
These are my assumptions, and each one is explained below. Use the free tools linked in each section to make your own. This isn’t investment advice: take responsibility for your own decisions.
On the ratings. Moody’s upgraded FICO to Ba1 from Ba2 on January 27, 2025 (Cbonds report of the action) and completed a periodic review on December 4, 2025; I couldn’t see the outcome, and I couldn’t check the rating after the 2026 debt-funded buybacks. Morningstar cut its moat from Wide to Narrow on October 21, 2026 (Morningstar note headline). Its uncertainty rating shows “High” on a Morningstar stock list that has no date and predates the downgrade, so it is unconfirmed. If the uncertainty were Medium the total would be 3.5/18, and if Very High 1.5/18.
📖 My Narratives
Bad: Fannie Mae and Freddie Mac treat VantageScore as a full equal. Lenders switch, and FICO cuts its mortgage score price to compete: the bureaus have priced VantageScore 4.0 at about $1 (Scotsman Guide; TransUnion’s $0.99 per Motley Fool, September 29, 2026), against FICO’s $10. About a quarter of Scores revenue is lost, and that revenue is almost pure profit, so margins fall. Debt stays high, so buybacks slow.
Base: FICO keeps its mortgage price through fiscal 2027 (on October 23 it said it would hold $10 per score for lenders in its preferred program, per a Morningstar note headline), then gives some of it back as lenders use both scores. Scores grows slowly and Software grows mid-single digits. The restructuring savings offset most of the margin lost to price concessions. Debt falls to about the 3.5x covenant level and then stays roughly flat in dollars.
Good: VantageScore stays a side option for most lenders, because investors in mortgage securities still want FICO. The Direct Licensing Program, which has agreements with partners and resellers covering about 60% of mortgage volume (Q3 call summaries by Nasdaq and MarketBeat, July 29, 2026; reseller coverage, not a lender count), goes live and adds revenue. Scores keeps growing near its history, the restructuring savings drop through, and debt is mostly repaid.
| Bad | Base | Good |
|---|---|---|---|
Revenue growth (Year 1 / Years 2-5) | 4% / 0% | 10% / 5% | 16% / 9% |
Operating margin (initial → terminal) | 50% → 42% | 51.5% → 50% | 52% → 55% |
Sales / Capital (initial → terminal) | 1.7 → 1.4 | 1.9 → 1.7 | 2.0 → 1.9 |
Terminal ROIC | 12% | 20% | 30% |
Terminal cost of capital | 9.78% | 9.0% | 7.85% |
Net margin (Year 5) / Shares CAGR / P/E (Year 5) | 21% / -0.5% / 14 | 31% / -2.0% / 22 | 38% / -3.5% / 30 |
Methods: DCF 60%, EPS Growth 40%, because FICO is a profitable business that reinvests little, so cash flows and earnings tell the story. There is no dividend method: FICO stopped paying dividends in fiscal 2017 (cash flow statement). I left out the historical multiples too. FICO’s P/E ranged from 30x to 69x over the last 10 years as its pricing power grew, and the VantageScore decision breaks that history, so the old averages (43.7x P/E, 31.1x EV/EBITDA) would say “very cheap” for the wrong reason.
The Base narrative drives each valuation. Bad and Good set the low and high end of each Monte Carlo range.
📈Business Valuation
Revenue Growth
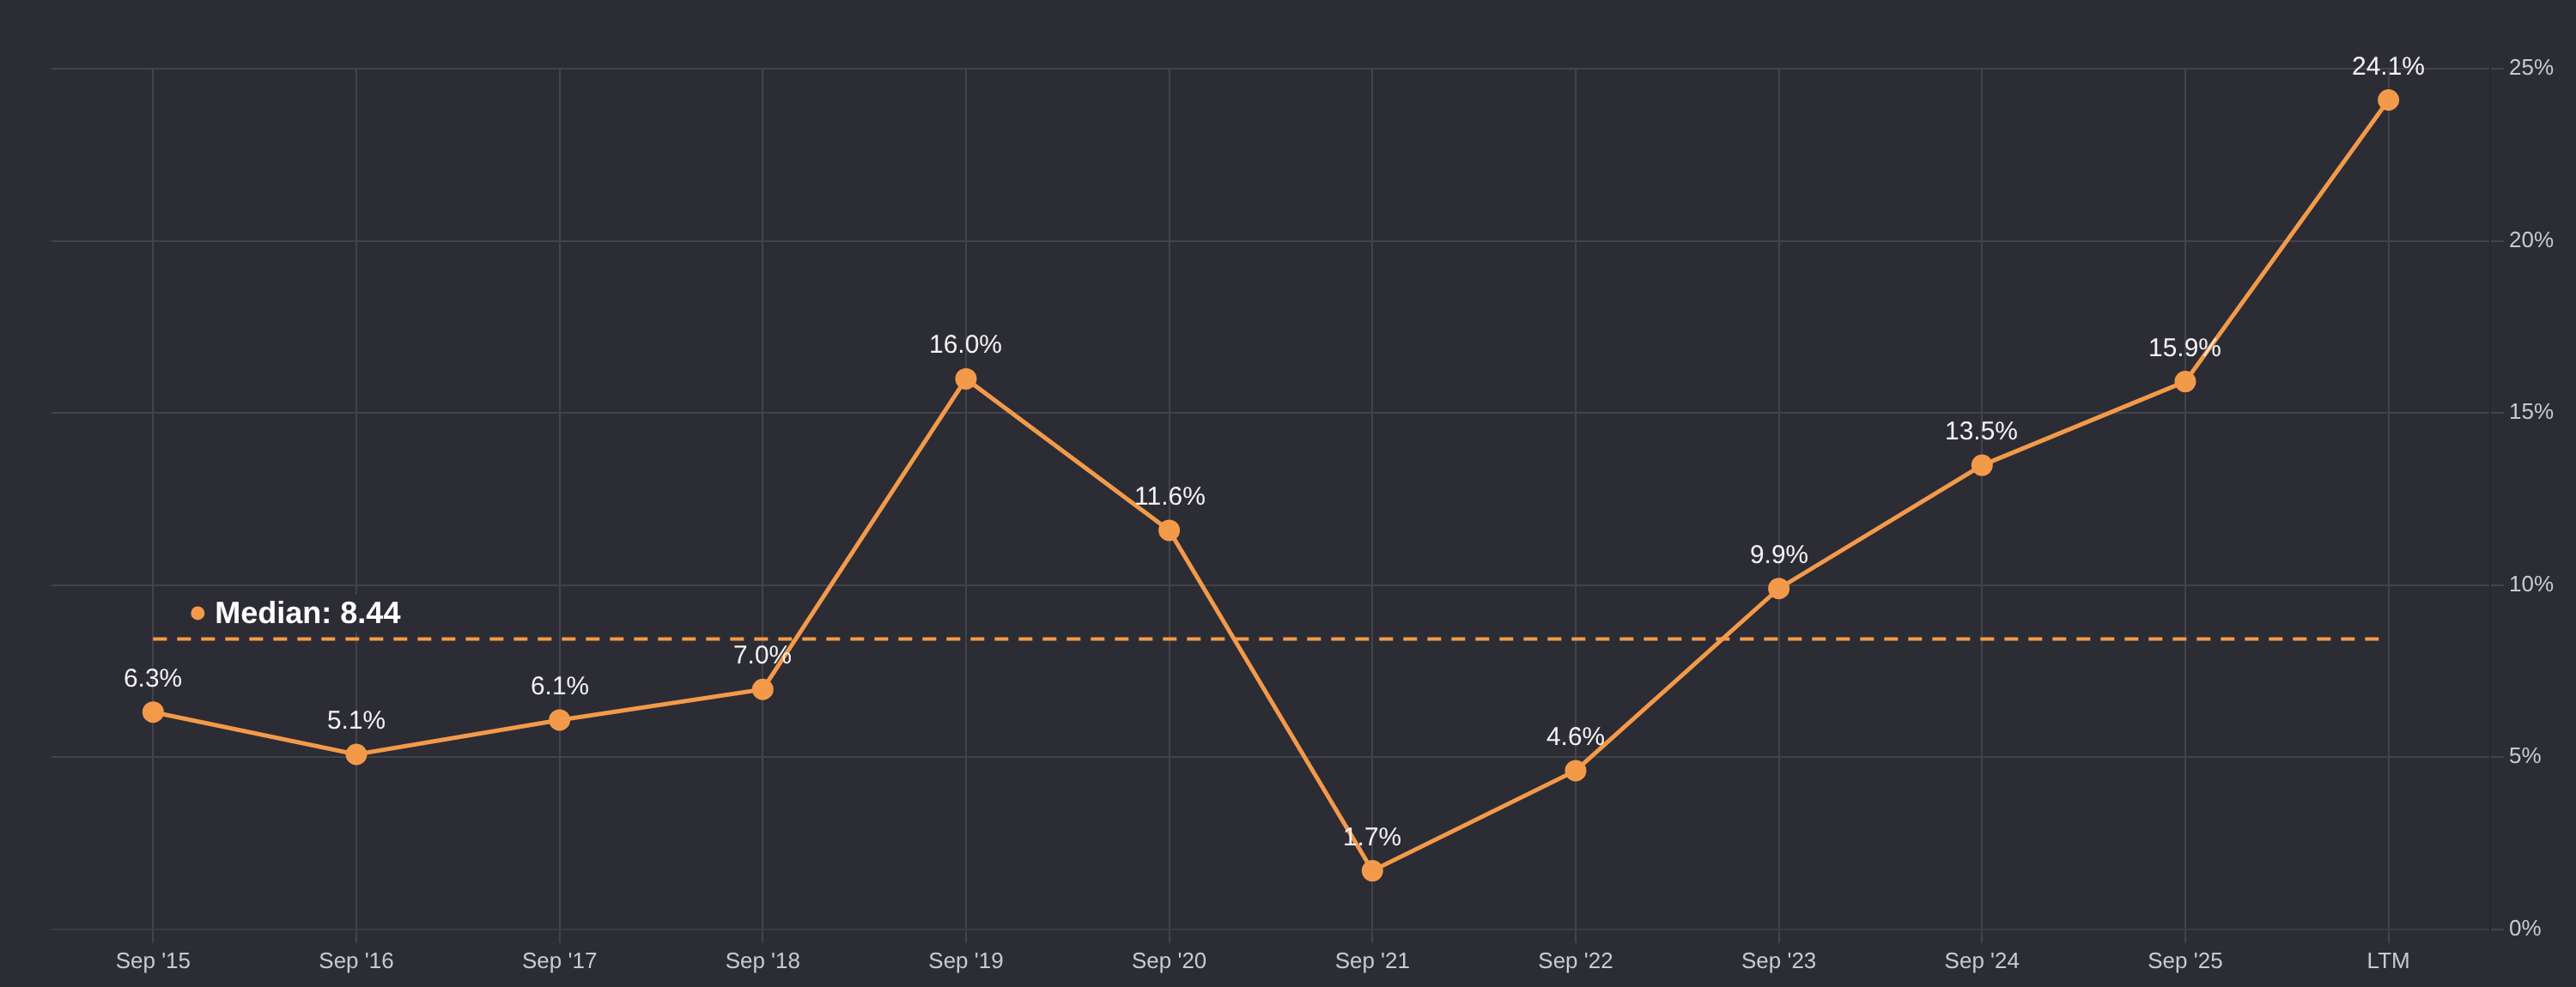
Growth has a median of 8.4% over ten years and has been speeding up: 13.5% in fiscal 2024, 15.9% in fiscal 2025 and 24.1% for the last twelve months (10-K and 10-Q). Most of the jump is price: Scores revenue rose 41% in Q3 on a higher mortgage score price. On the Q3 call, management said mortgage score volumes were up low single digits and that it hadn’t seen meaningful volume loss from lenders using VantageScore alongside FICO (call summaries by Nasdaq and MarketBeat, July 29, 2026). Guidance for fiscal 2026 is $2.53 billion, up from $2.45 billion (Q3 release).
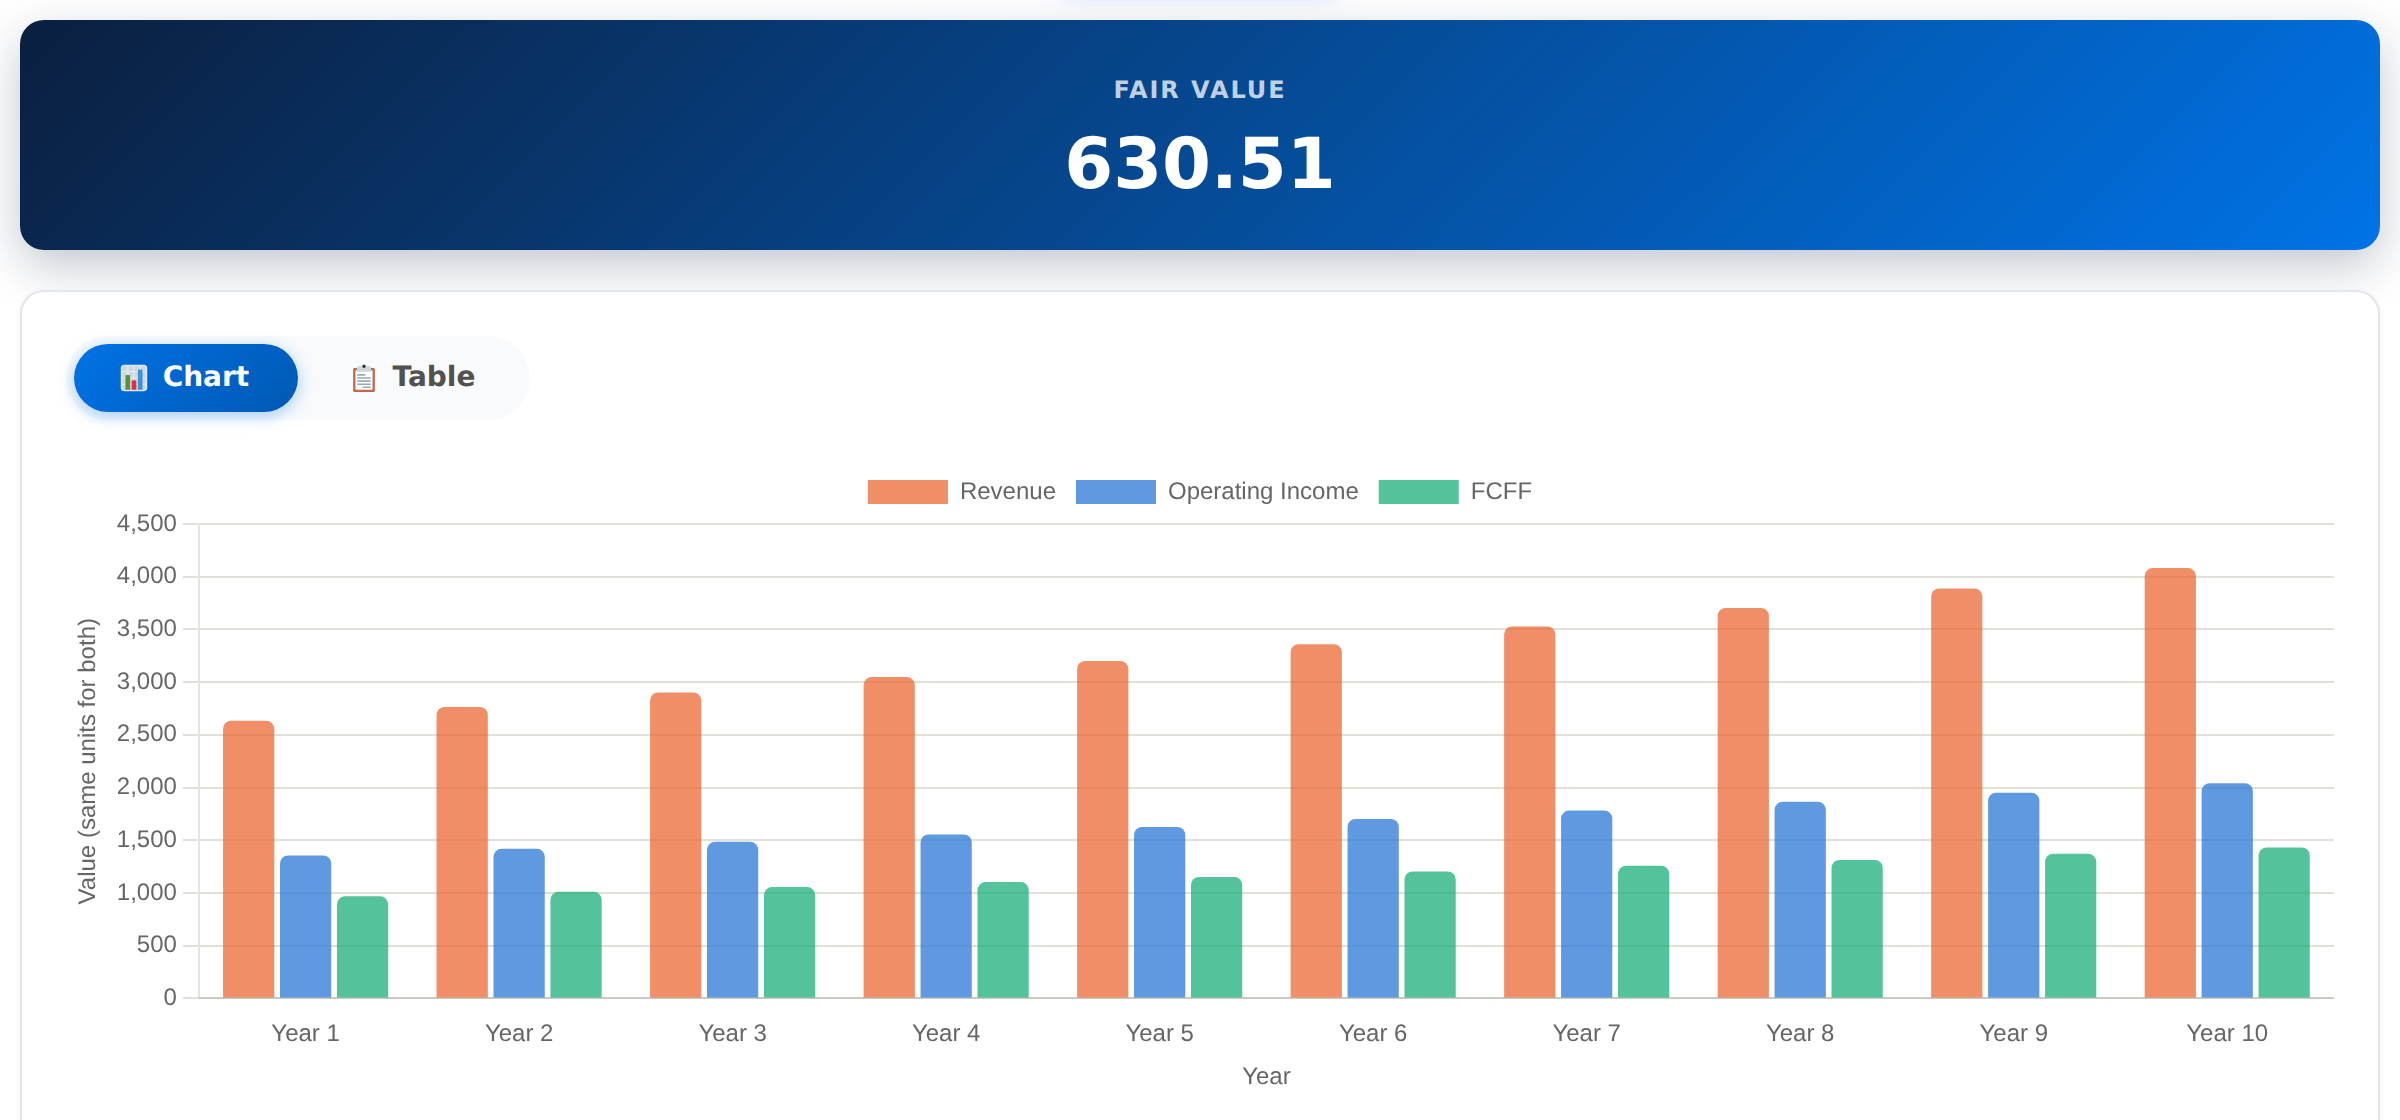
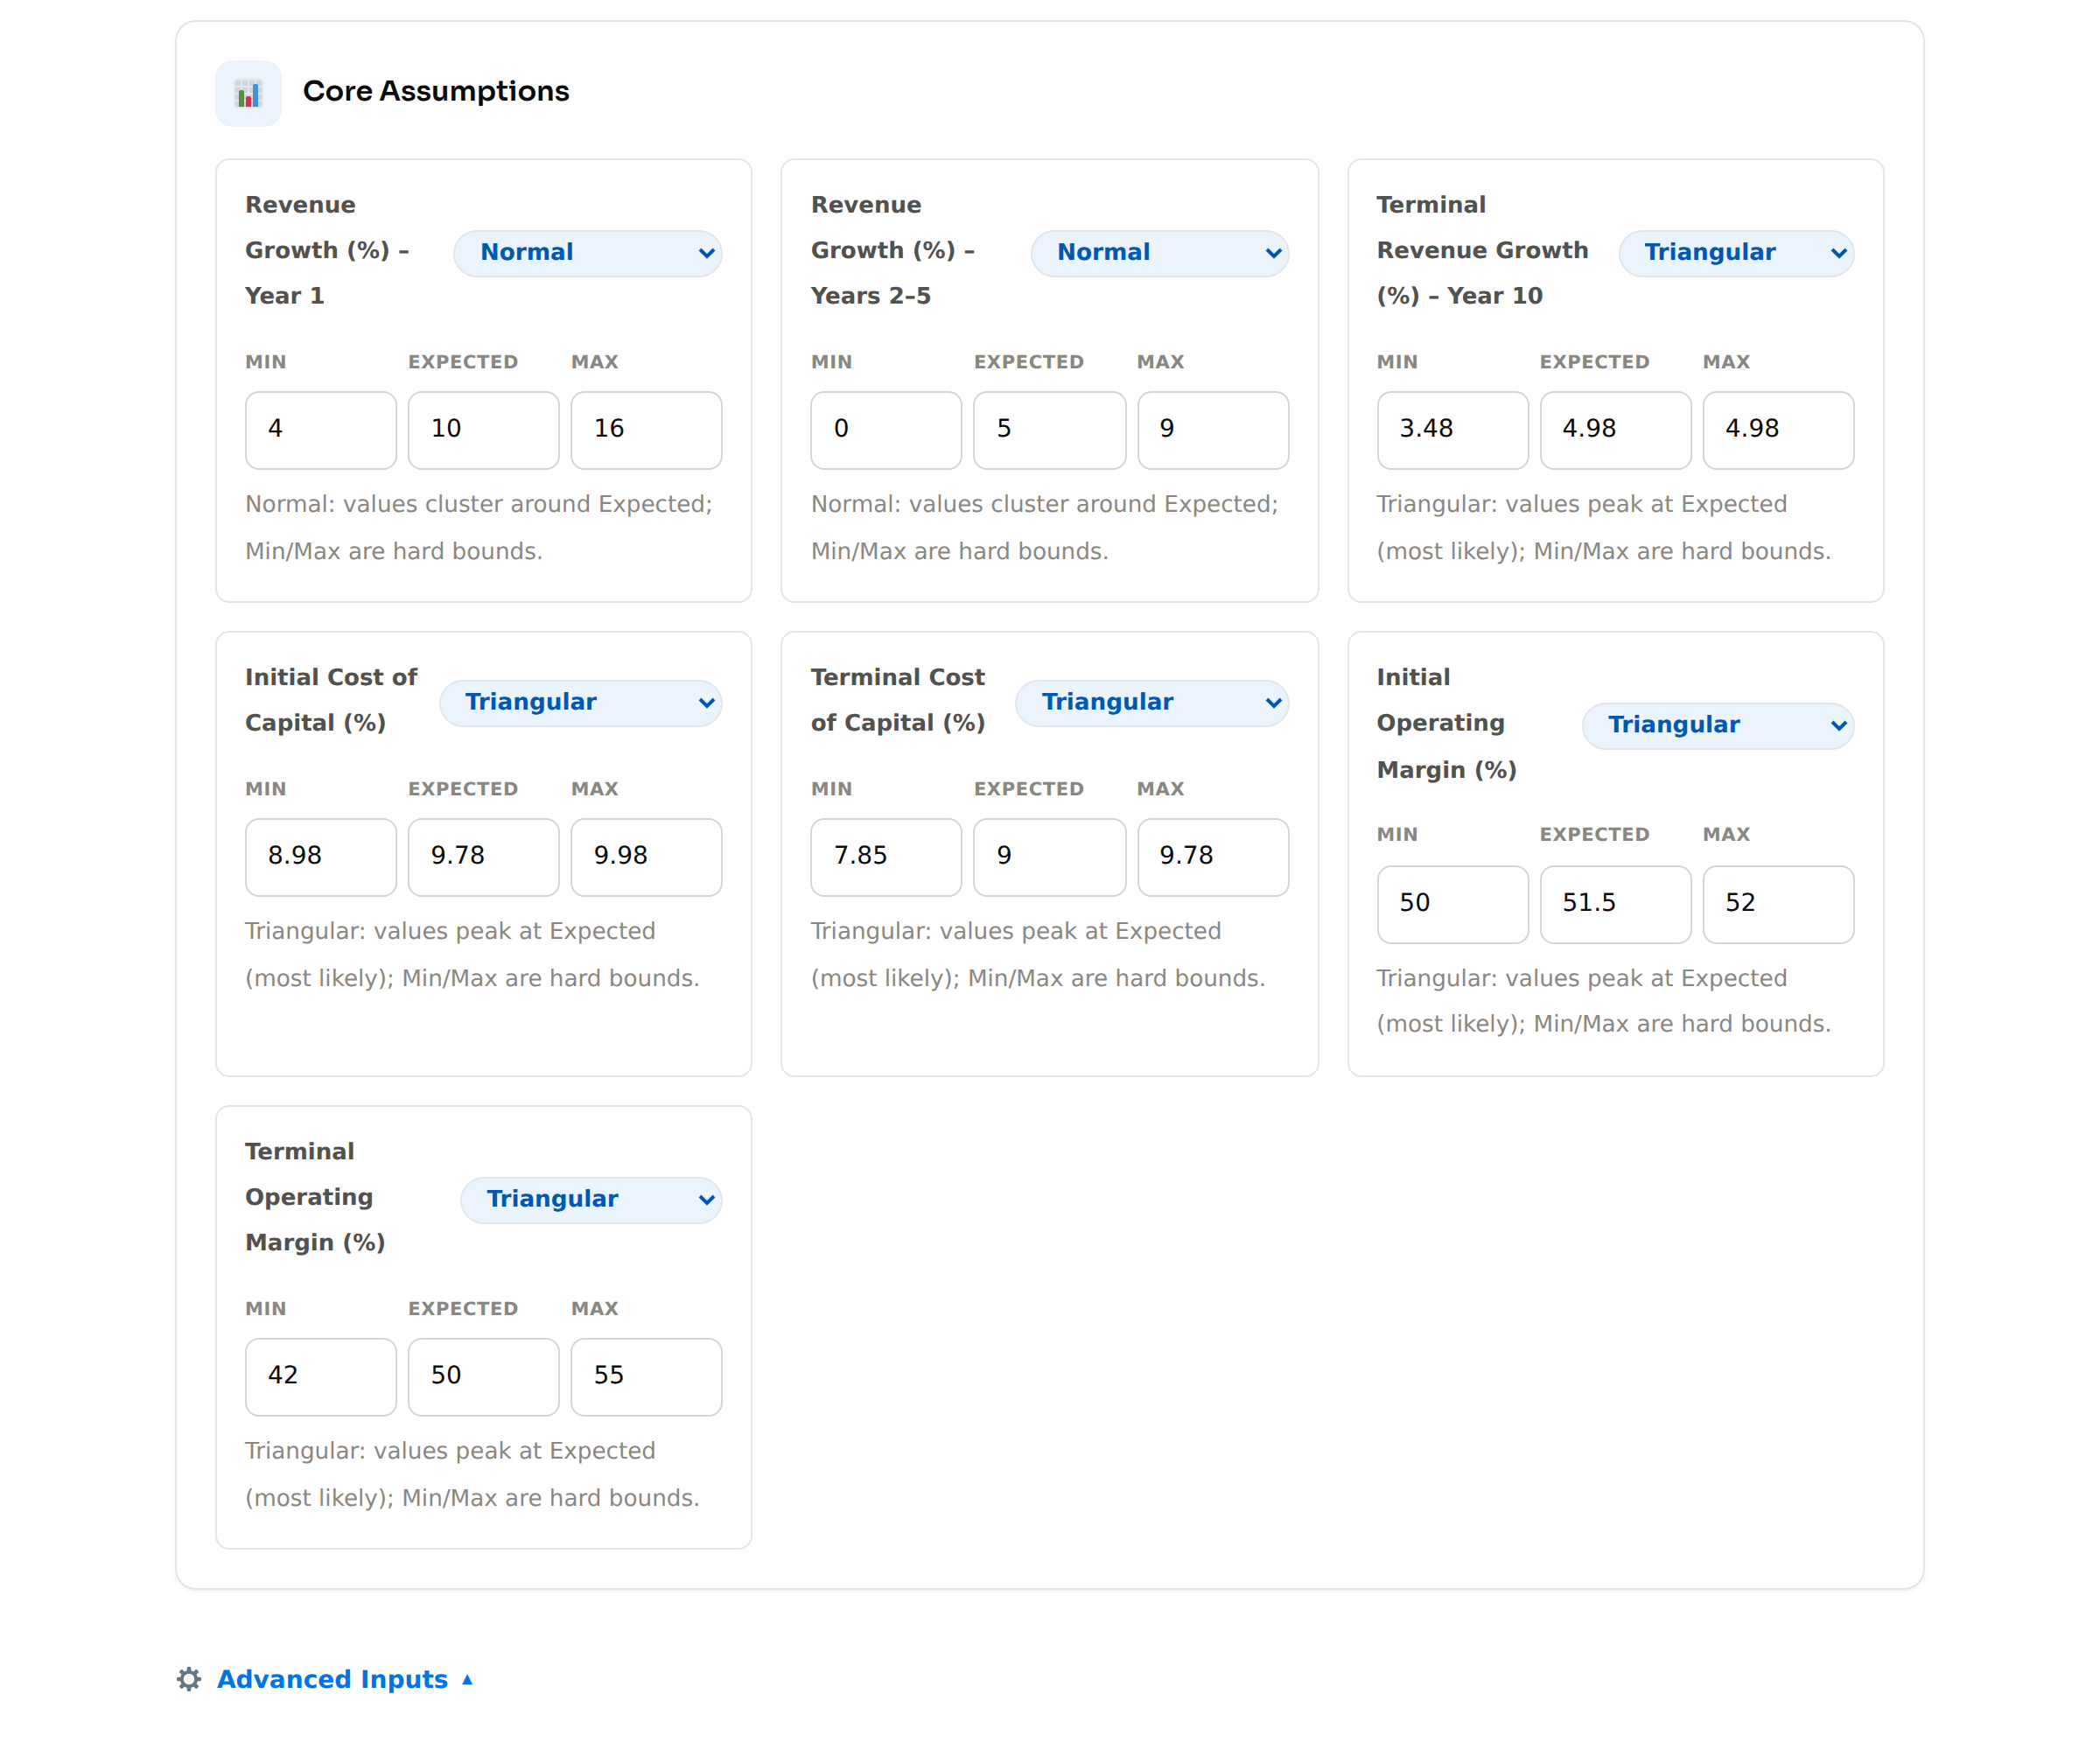
💡 Year 1: 10% (Bad 4% · Good 16%). Years 2-5: 5% (Bad 0% · Good 9%). Year 1 is revenue to June 2027. Base is $2.63 billion, between fiscal 2026 guidance ($2.53 billion) and the Q3 run rate ($2.70 billion annualised), because the price rise is already in the numbers and I expect concessions later. Years 2-5 are below the 5-year CAGR of 9.0% because price is no longer the growth engine. Bad has price cuts start in the first half of fiscal 2027, so revenue slips below guidance. Good returns to the historical 9%.
Cost of Capital
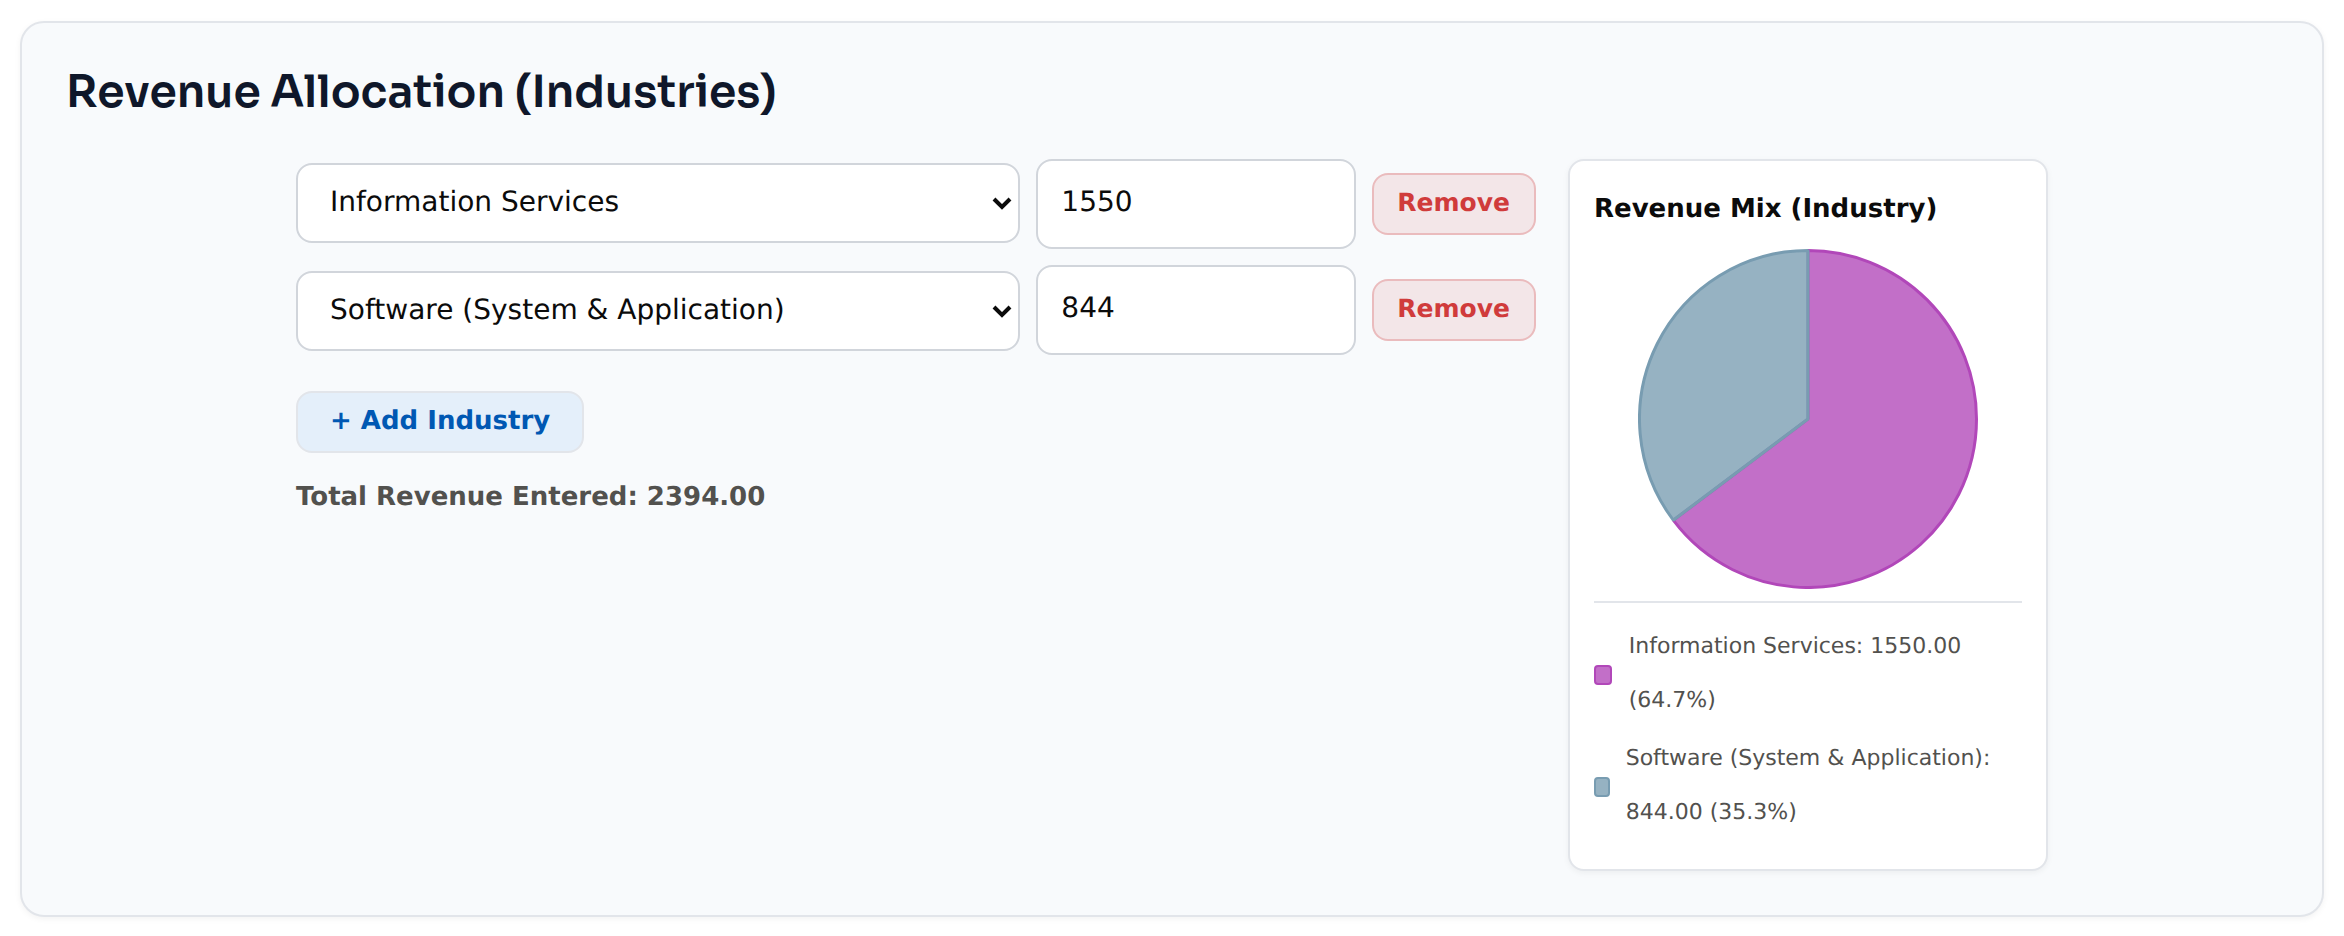
Inputs: the latest 10-Q, the 10-year US bond (4.98%) as the risk-free rate, and revenue by industry and geography. Debt rating: Moody’s Ba1. Total debt of $5,646 million is the face value of borrowings, $5,610 million (revolver, term loan and senior notes, June 30, 2026 10-Q; the balance sheet shows $5,582 million net of issuance costs), plus $36 million of operating and finance leases ($28.8 million and $7.2 million, September 2025 10-K, the latest total disclosed). I split revenue across two industries: Information Services for Scores ($1,550 million) and Software (System & Application) for Software ($844 million), both TTM to June 2026. For geography I used the fiscal 2025 split, the latest disclosed: Americas 87% (entered as United States) and EMEA plus Asia Pacific 13% (entered as Global).
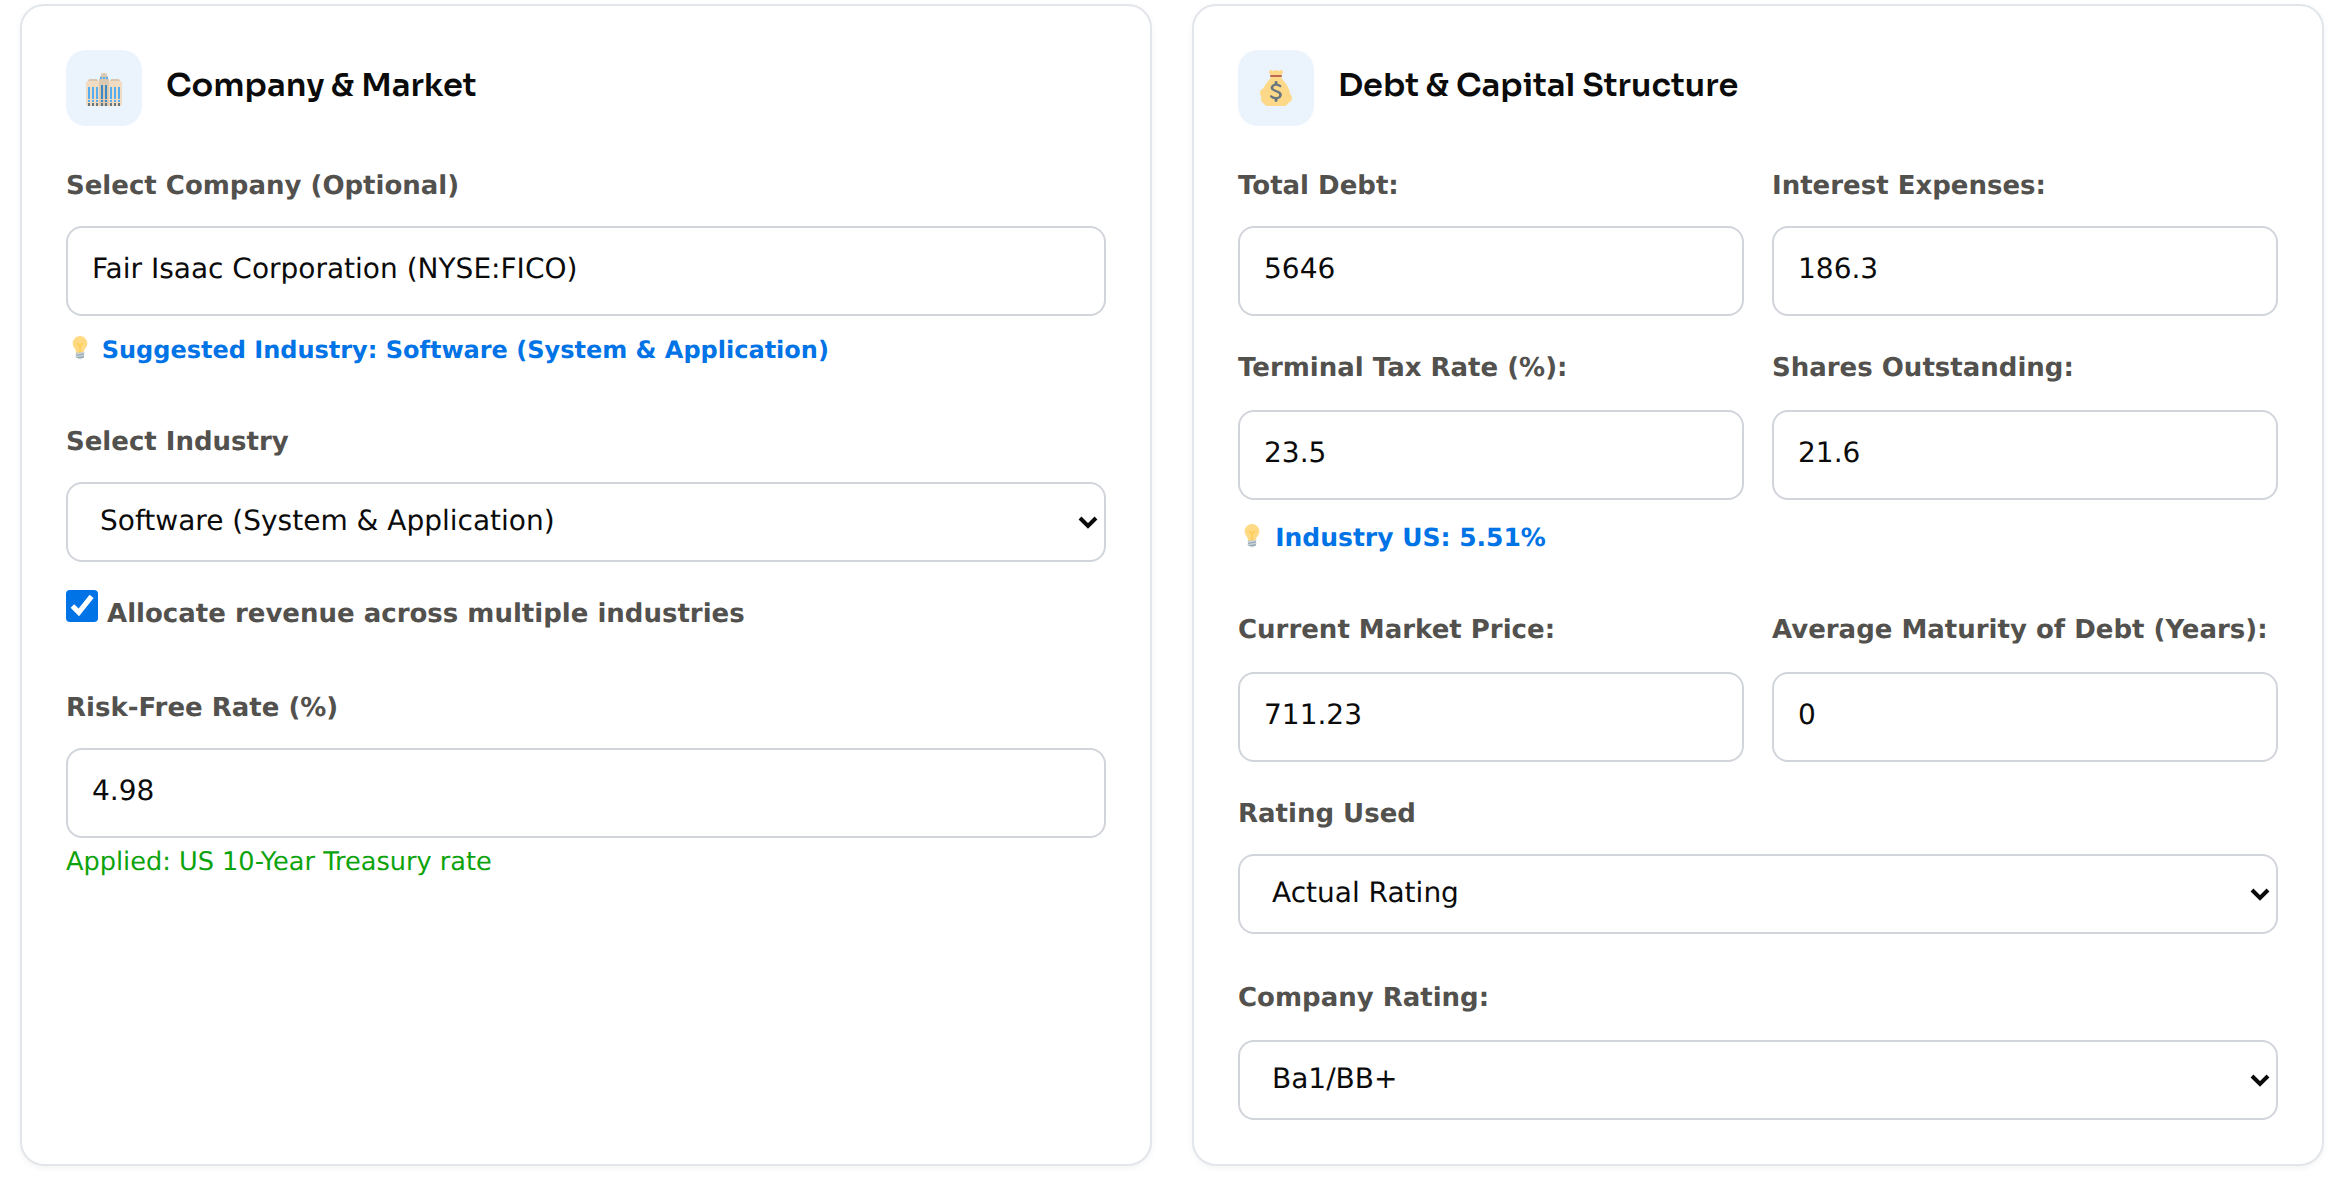
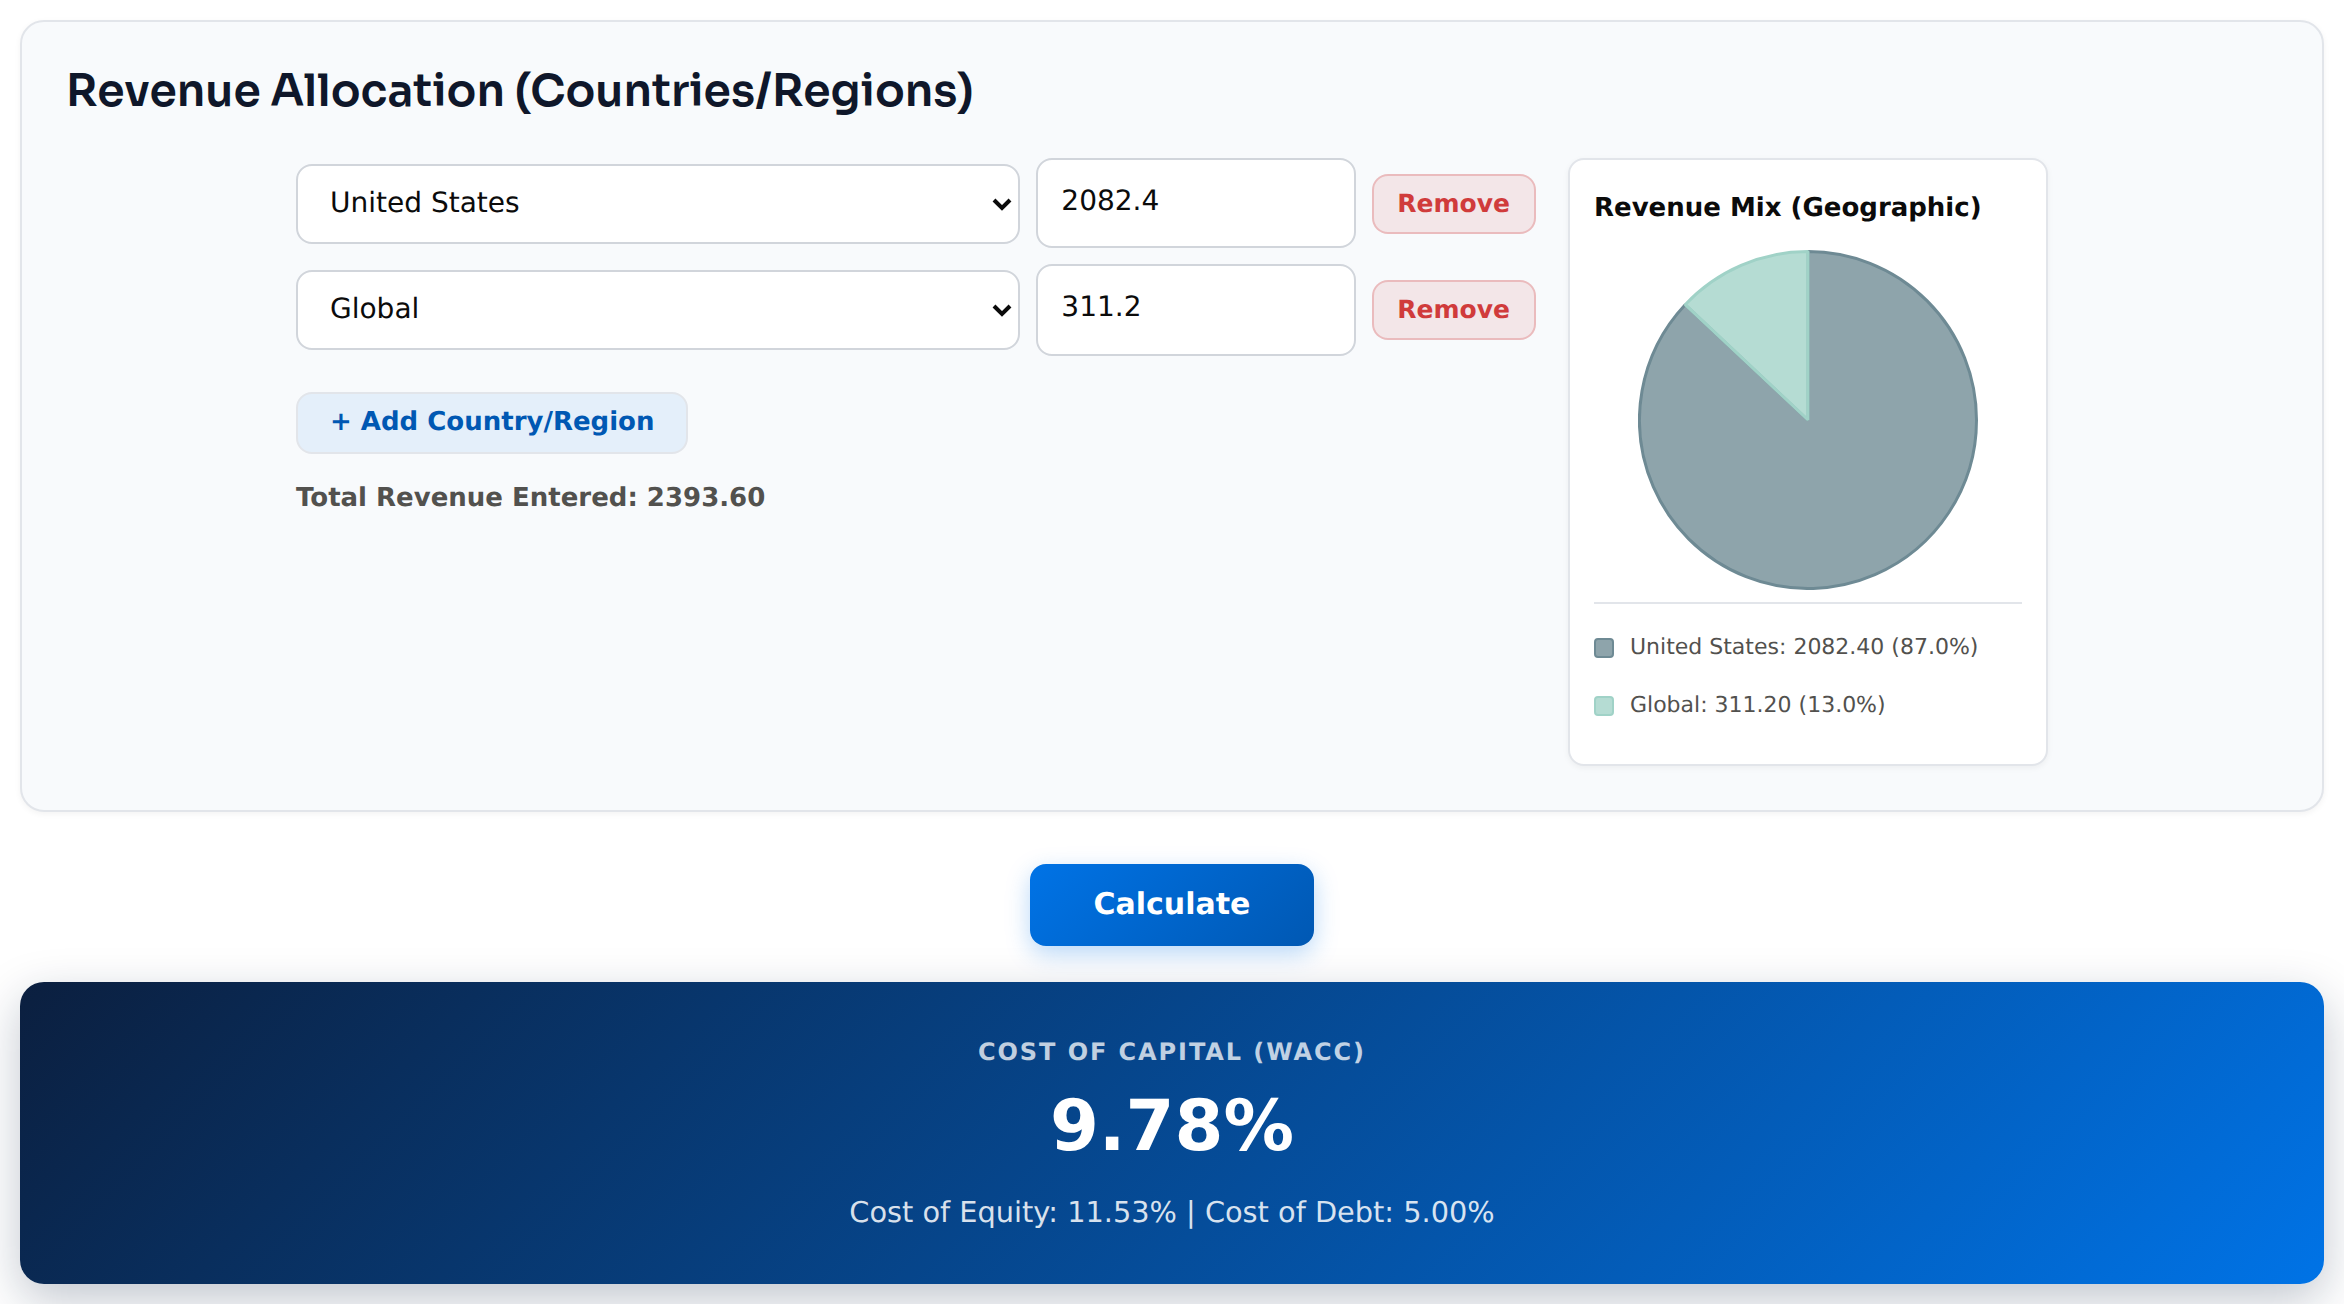
Cost of Capital: 9.78% (blended industry average in the US: ~7.83%, from 7.00% for Information Services and 9.34% for Software, weighted by revenue; the Software figure is shown in the DCF screenshot below). Cost of equity is 11.53%.
💡 It starts at 9.78% and converges to 9.0% (Bad 9.78% · Good 7.85%). In Base, debt falls from $5.6 billion to about $4.5 billion: the credit agreement caps leverage at 4.5x until December 30, 2026, 4.0x until December 30, 2027 and 3.5x after that (10-Q), and management plans to pay debt down. That is the same path behind the Base net margin below. I keep Base well above the 7.83% industry floor because debt stays large and the pricing fight leaves earnings less certain. Bad keeps today’s rate and debt at $5.6 billion. Good repays most of the debt and reaches the industry floor.
Try it yourself: Cost of Capital – The Fair Value Journal (free).
Operating Margin
FICO discloses two business segments with operating income, and revenue by geography without operating income.
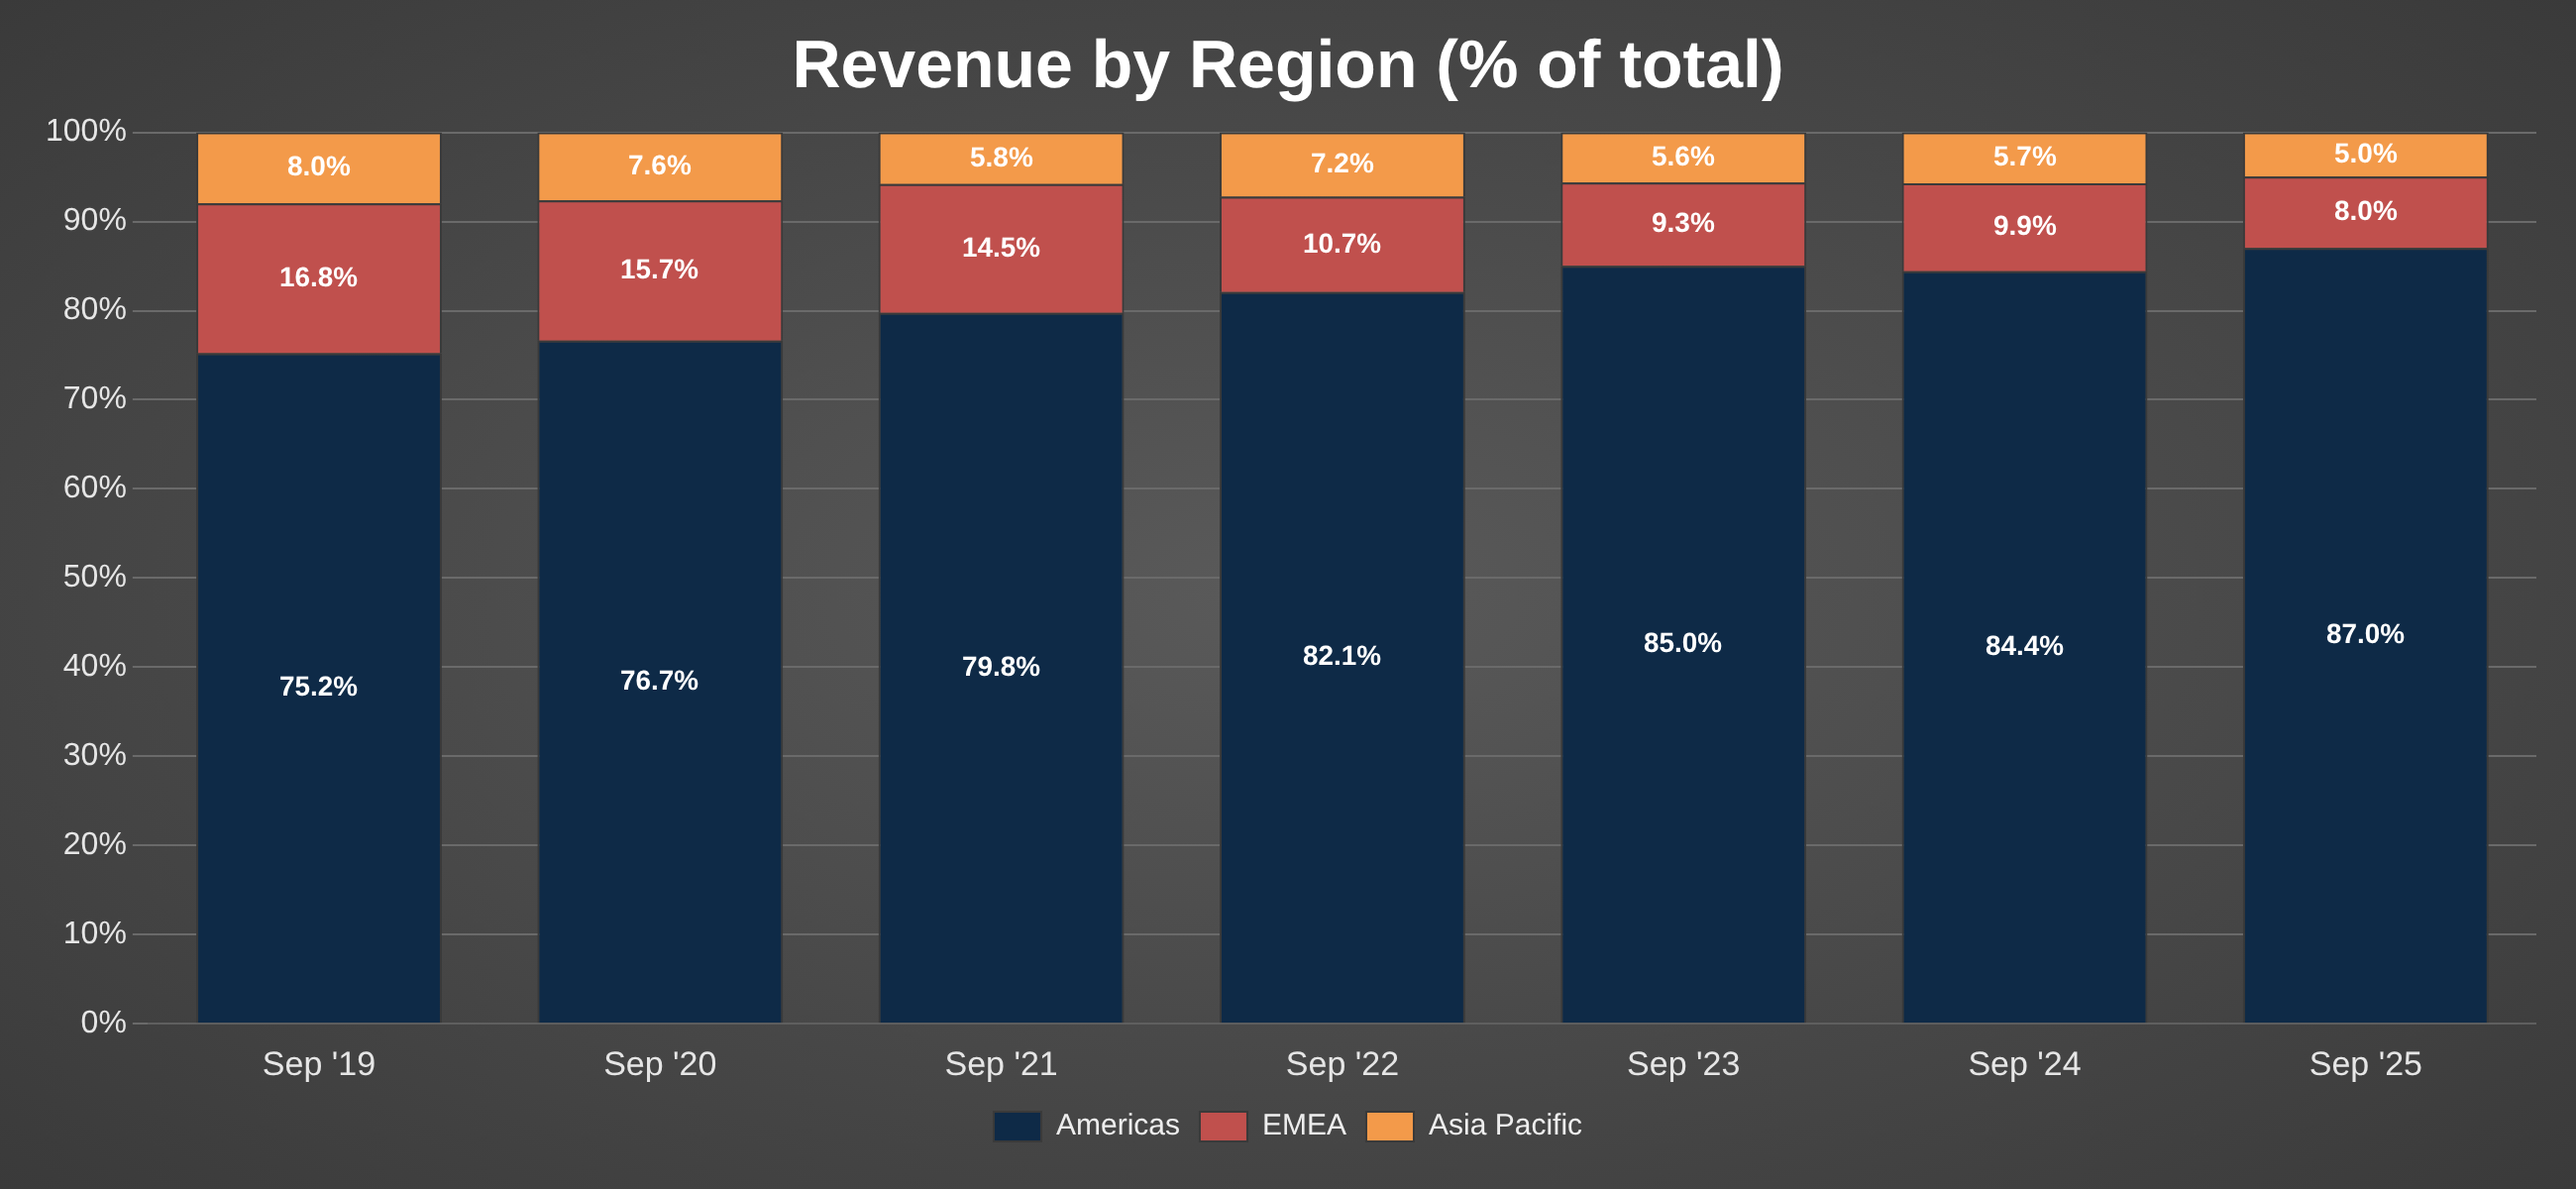
Geographic Segments
Americas: 87.0% of revenue (fiscal 2025, 10-K): almost all US mortgage, card and auto lending, driven by Scores. EMEA: 8.0% and Asia Pacific: 5.0%: mostly Software, since Scores revenue was only $7 million in each region. Geography discloses no operating income, so there is no margin by region. The mix has moved to the Americas (75% in fiscal 2019 to 87%) as US scores grew. That is a concentration: FICO’s profit depends on US lending and on US rules.
Business Segments
Scores: 64.8% of revenue, operating margin 89.7% (TTM, 10-K and 10-Q). It licenses the FICO Score to bureaus, lenders and others, paid per score. Costs are tiny, so each extra dollar of price falls almost fully to profit, and each dollar lost does the same.
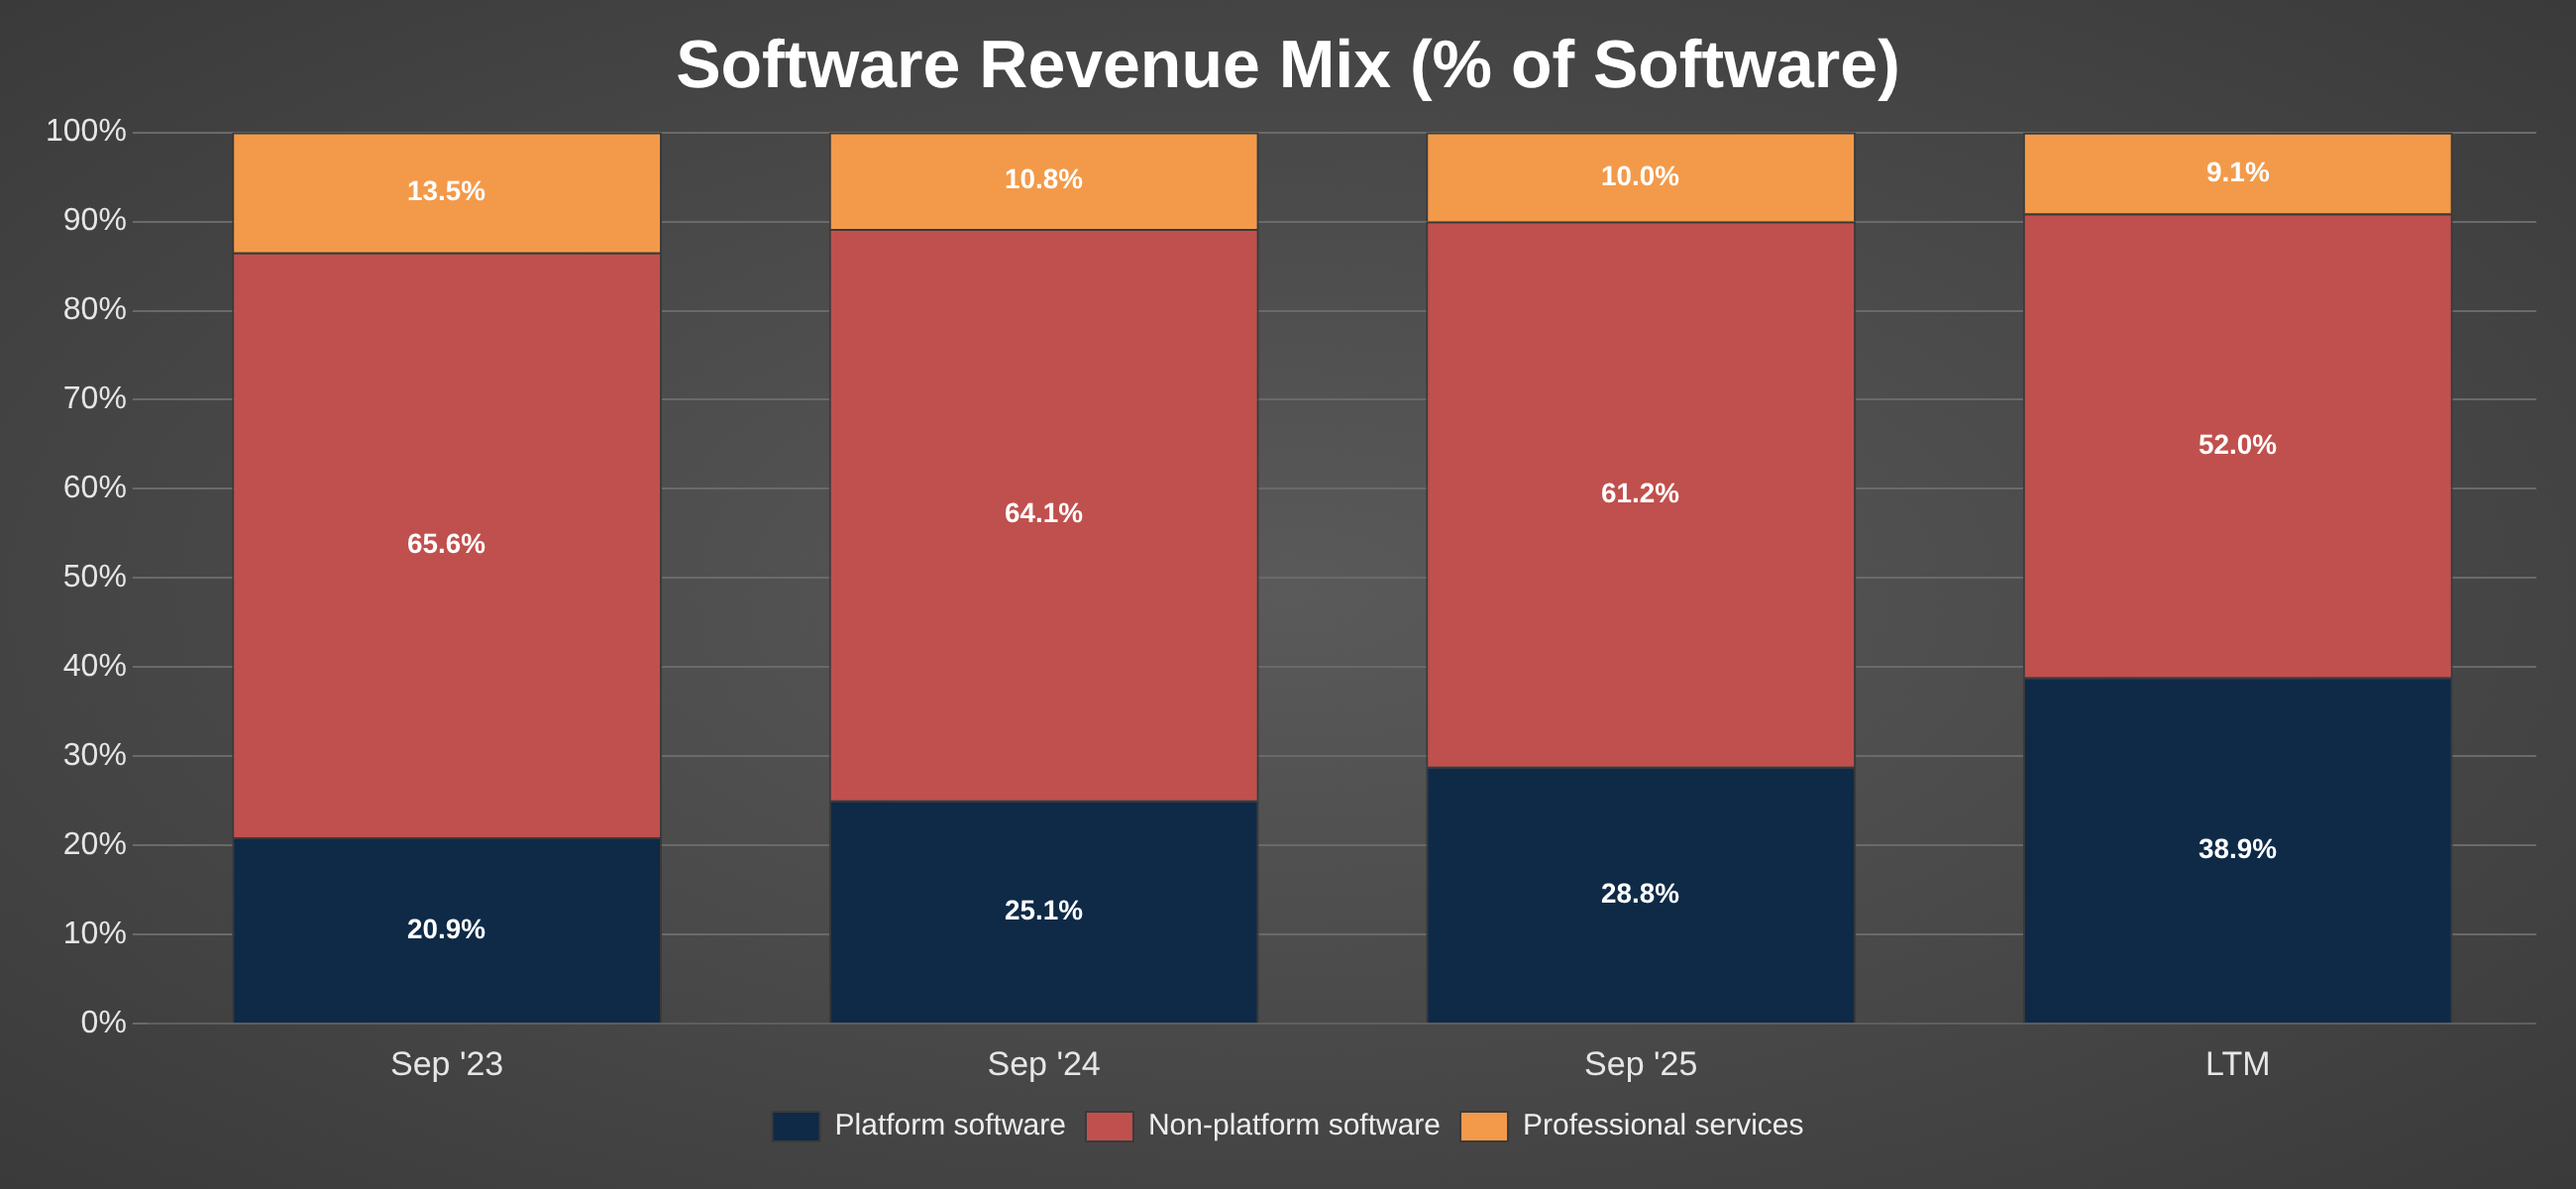
Software: 35.2% of revenue, operating margin 27.5%. It sells decision and fraud tools. Platform software, the cloud product, grew from 20.9% of Software in fiscal 2023 to 38.9% now, while professional services shrank to 9.1%. Margin peaked at 32.6% in fiscal 2023 and has slipped.
Segment margins exclude corporate costs and stock compensation, which together took $294 million in the nine months to June 2026, 15.7% of revenue. That is why the consolidated margin is lower than either segment.
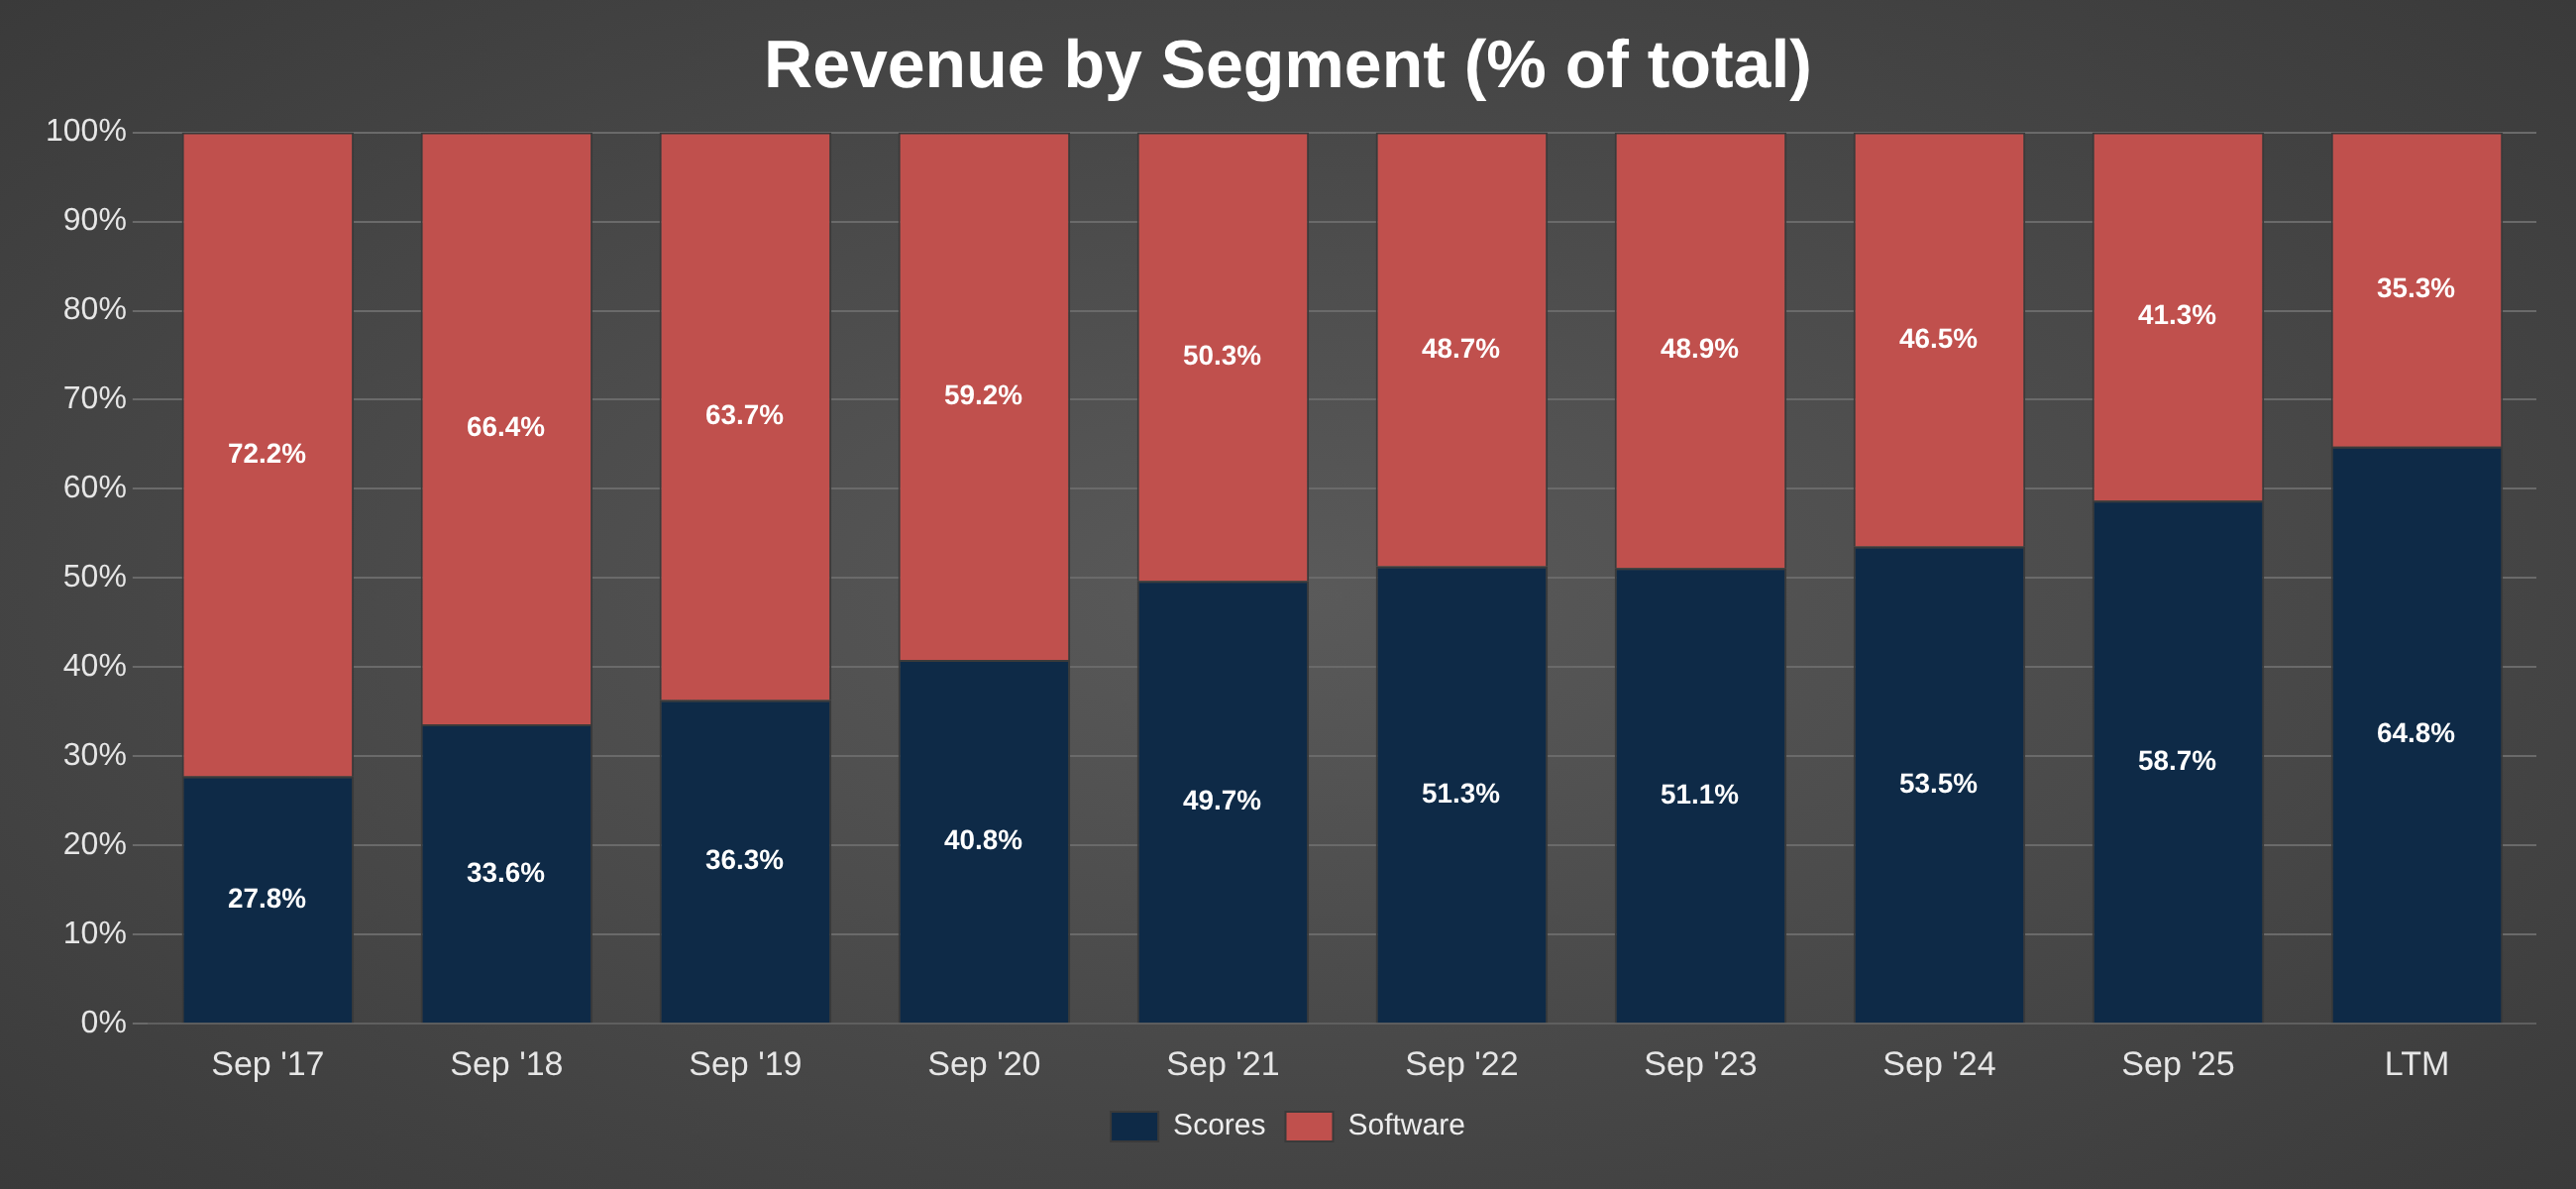
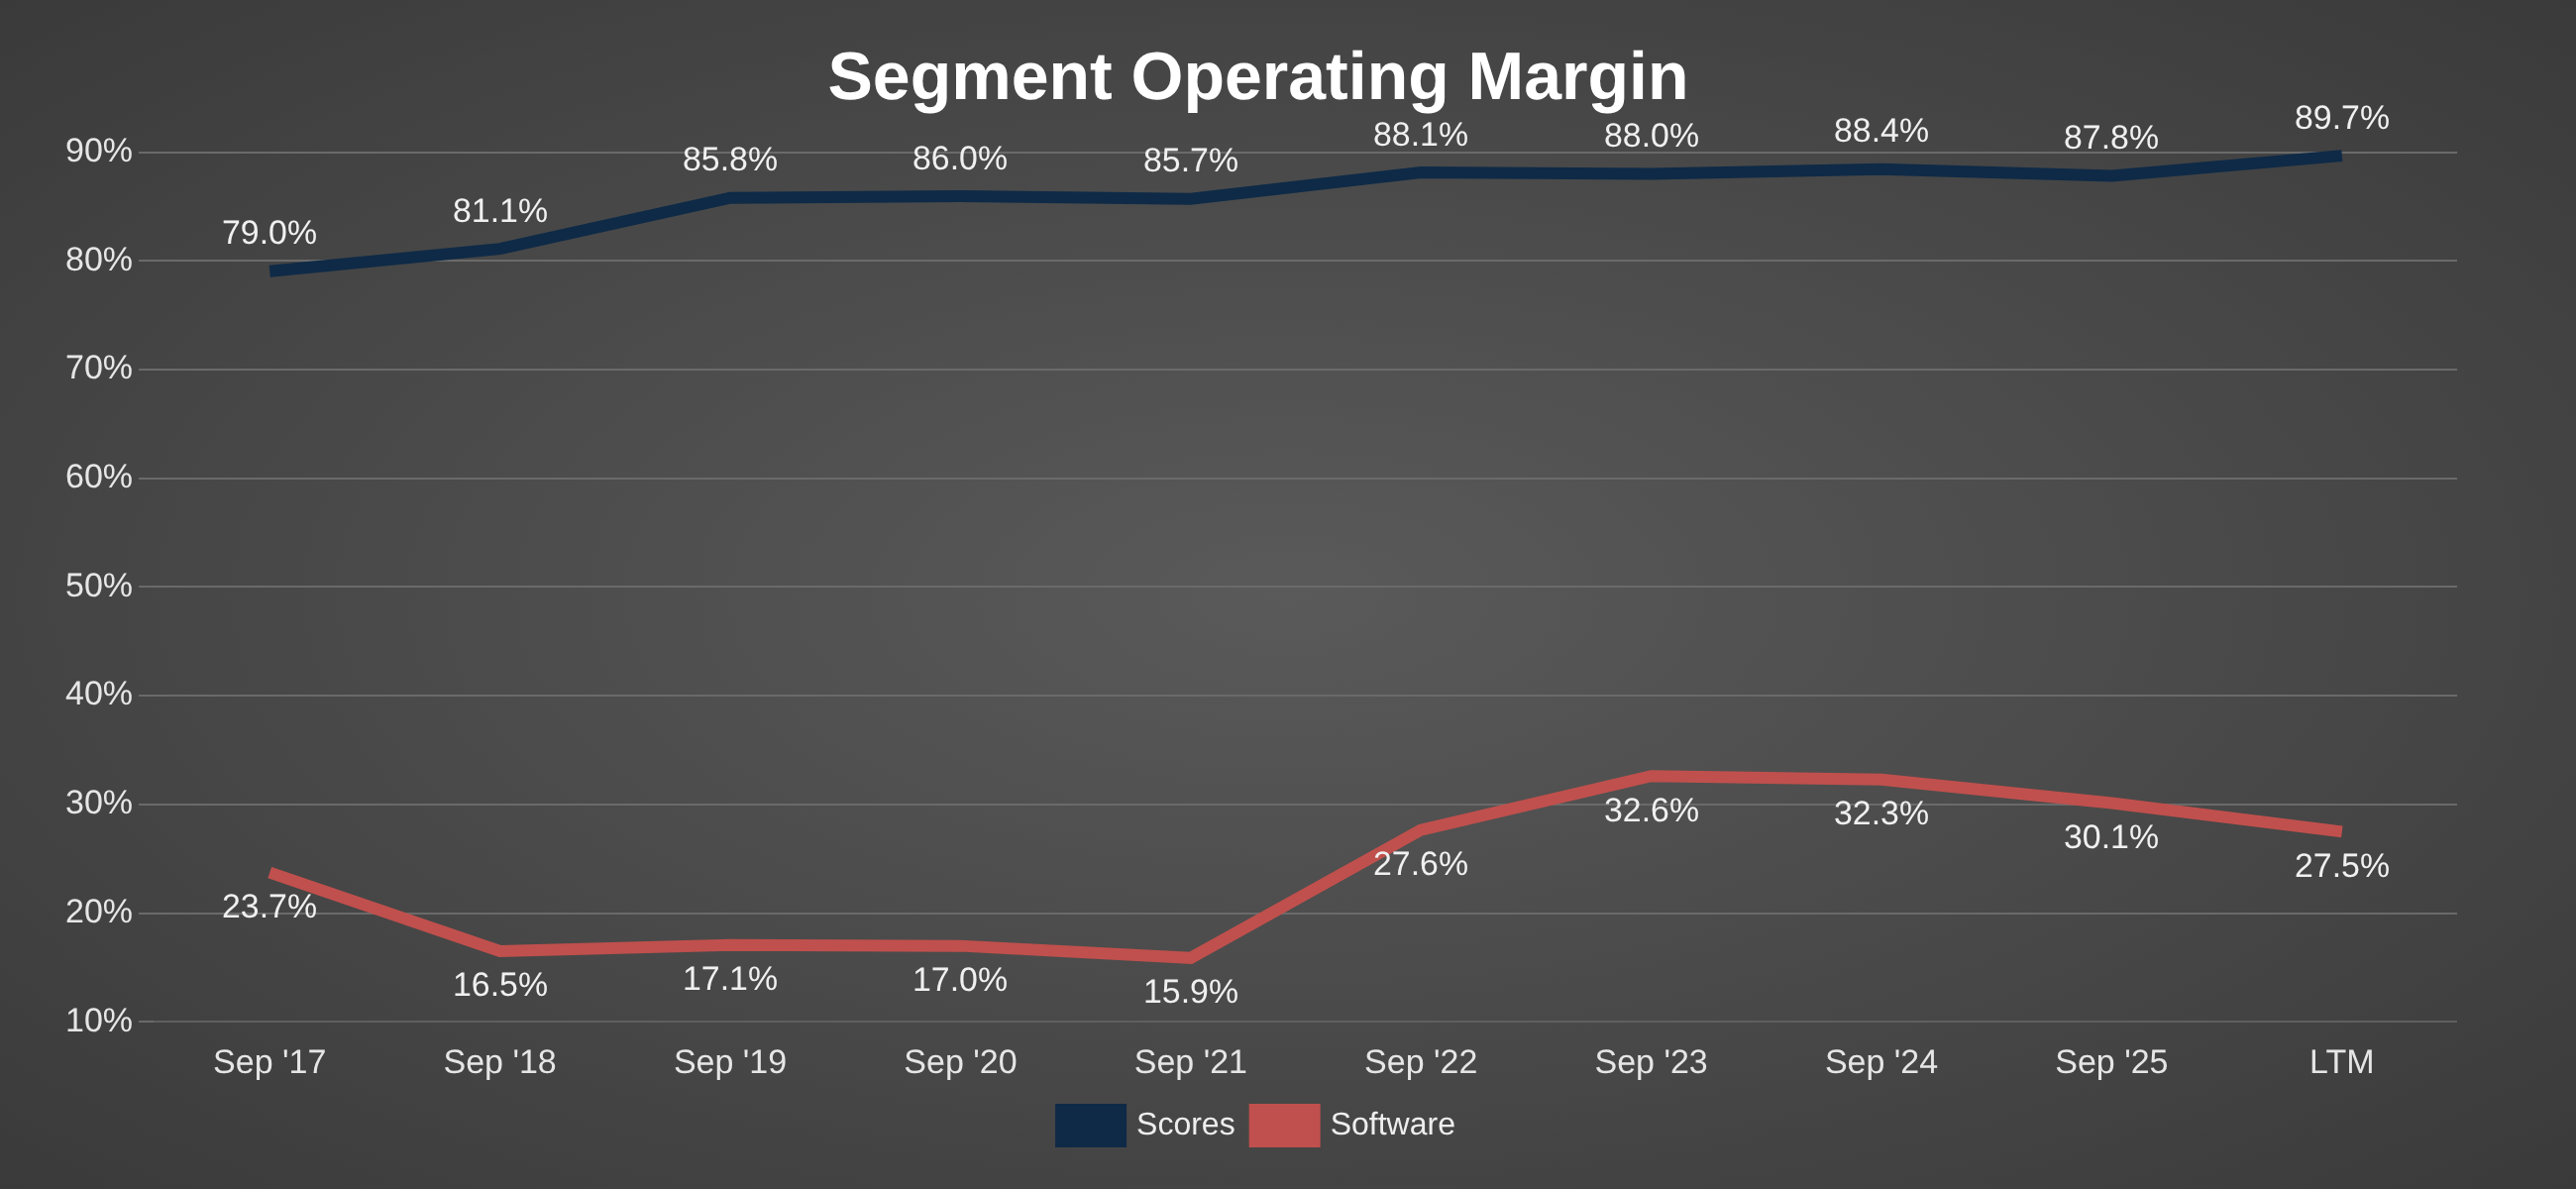
Scores went from 28% to 65% of revenue in nine years, and its 85-90% margin lifted the whole company. This means the margin assumption is mostly a call on how much Scores revenue FICO keeps. The three credit bureaus were also 60% of revenue in the first nine months of fiscal 2026 (51% in fiscal 2025, 10-Q and 10-K). They co-own VantageScore, so the biggest customers are also the rival’s owners. Segment margins before fiscal 2022 follow the older Applications and Decision Management split, so they are not exactly comparable.
Overall Operating Margin
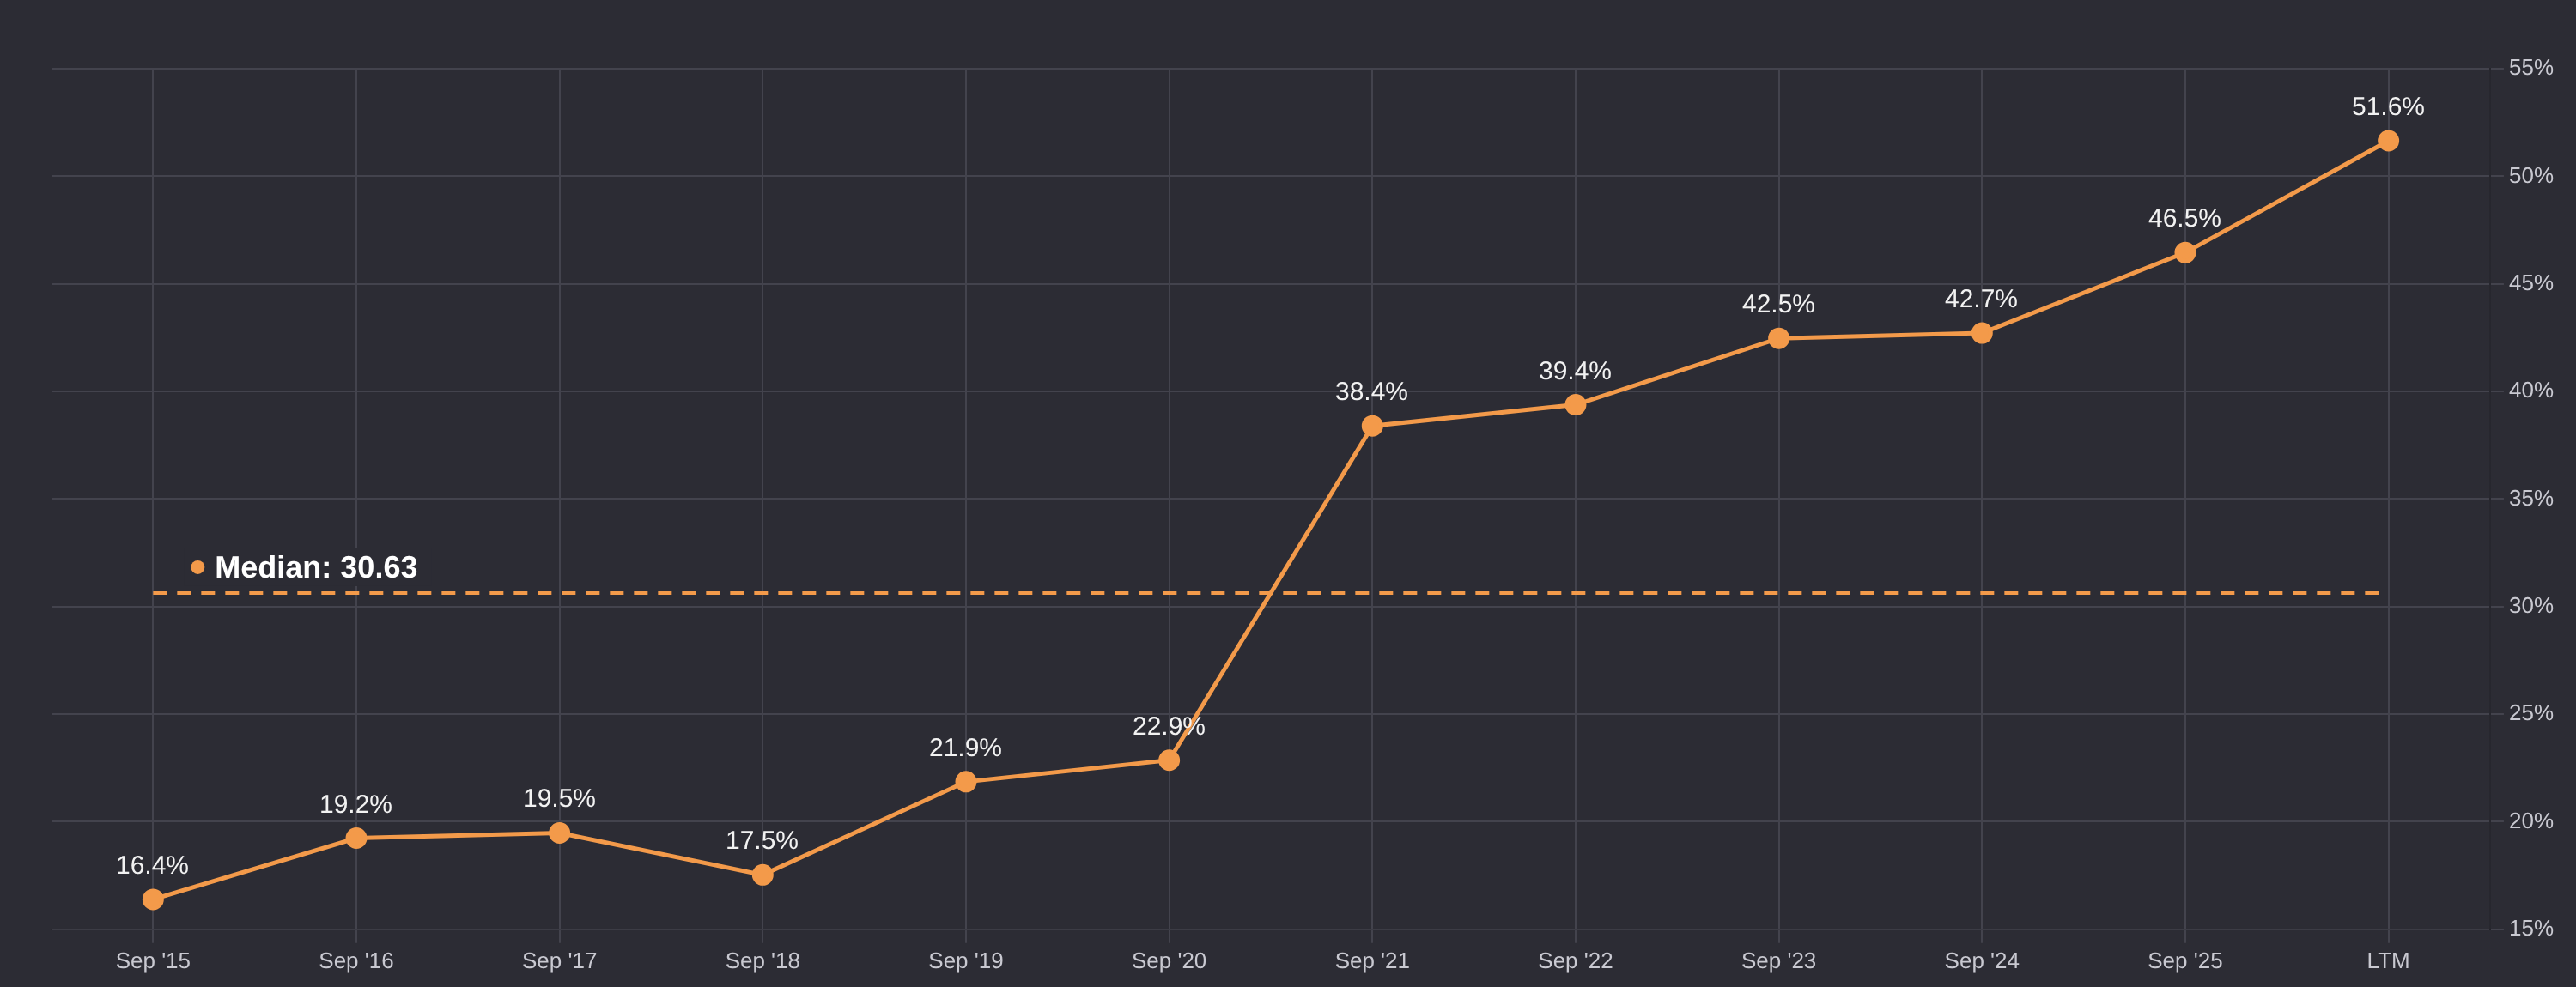
💡 Starts at 51.5% (Bad 50% · Good 52%) and converges to 50% (Bad 42% · Good 55%). The start is the TTM margin (51.65%), a little below the 9-month margin of 53.2%, because fiscal 2026 guidance implies fourth-quarter revenue of about $652 million, below Q3’s $674 million. The 10-year median is 30.6% and the 5-year average 41.9%, so even 50% is well above history.
Two forces move Base. Price concessions fall straight to profit: I assume they cost about 4.5 points over time. The restructuring gives back about 3 points: FICO doesn’t disclose its savings, so this is my estimate, assuming staff are about half to two-thirds of the roughly $1.16 billion annual cost base (TTM revenue less operating income), and 15% of that is about $85 million to $115 million, or about 3 points of year-5 revenue. The net is -1.5 points. The $27 million charge lands in the first forecast year (about 1 point of margin), which early savings roughly offset, so I leave the starting margin at 51.5%.
Bad: if about a quarter of Scores revenue is lost (25% of the $1,550 million TTM is about $390 million), operating income falls by about $350 million at the 90% segment margin. Growth elsewhere and the savings offset part of that, and a margin of 42% leaves room for the extra costs of defending share. Good: Scores keeps growing at about a 90% margin and the savings drop through, taking margin from the 9-month 53.2% to 55%.
Sales / Capital ratio (Reinvestment)
Revenue generated per dollar of invested capital. Investments can take a few years to turn into sales.
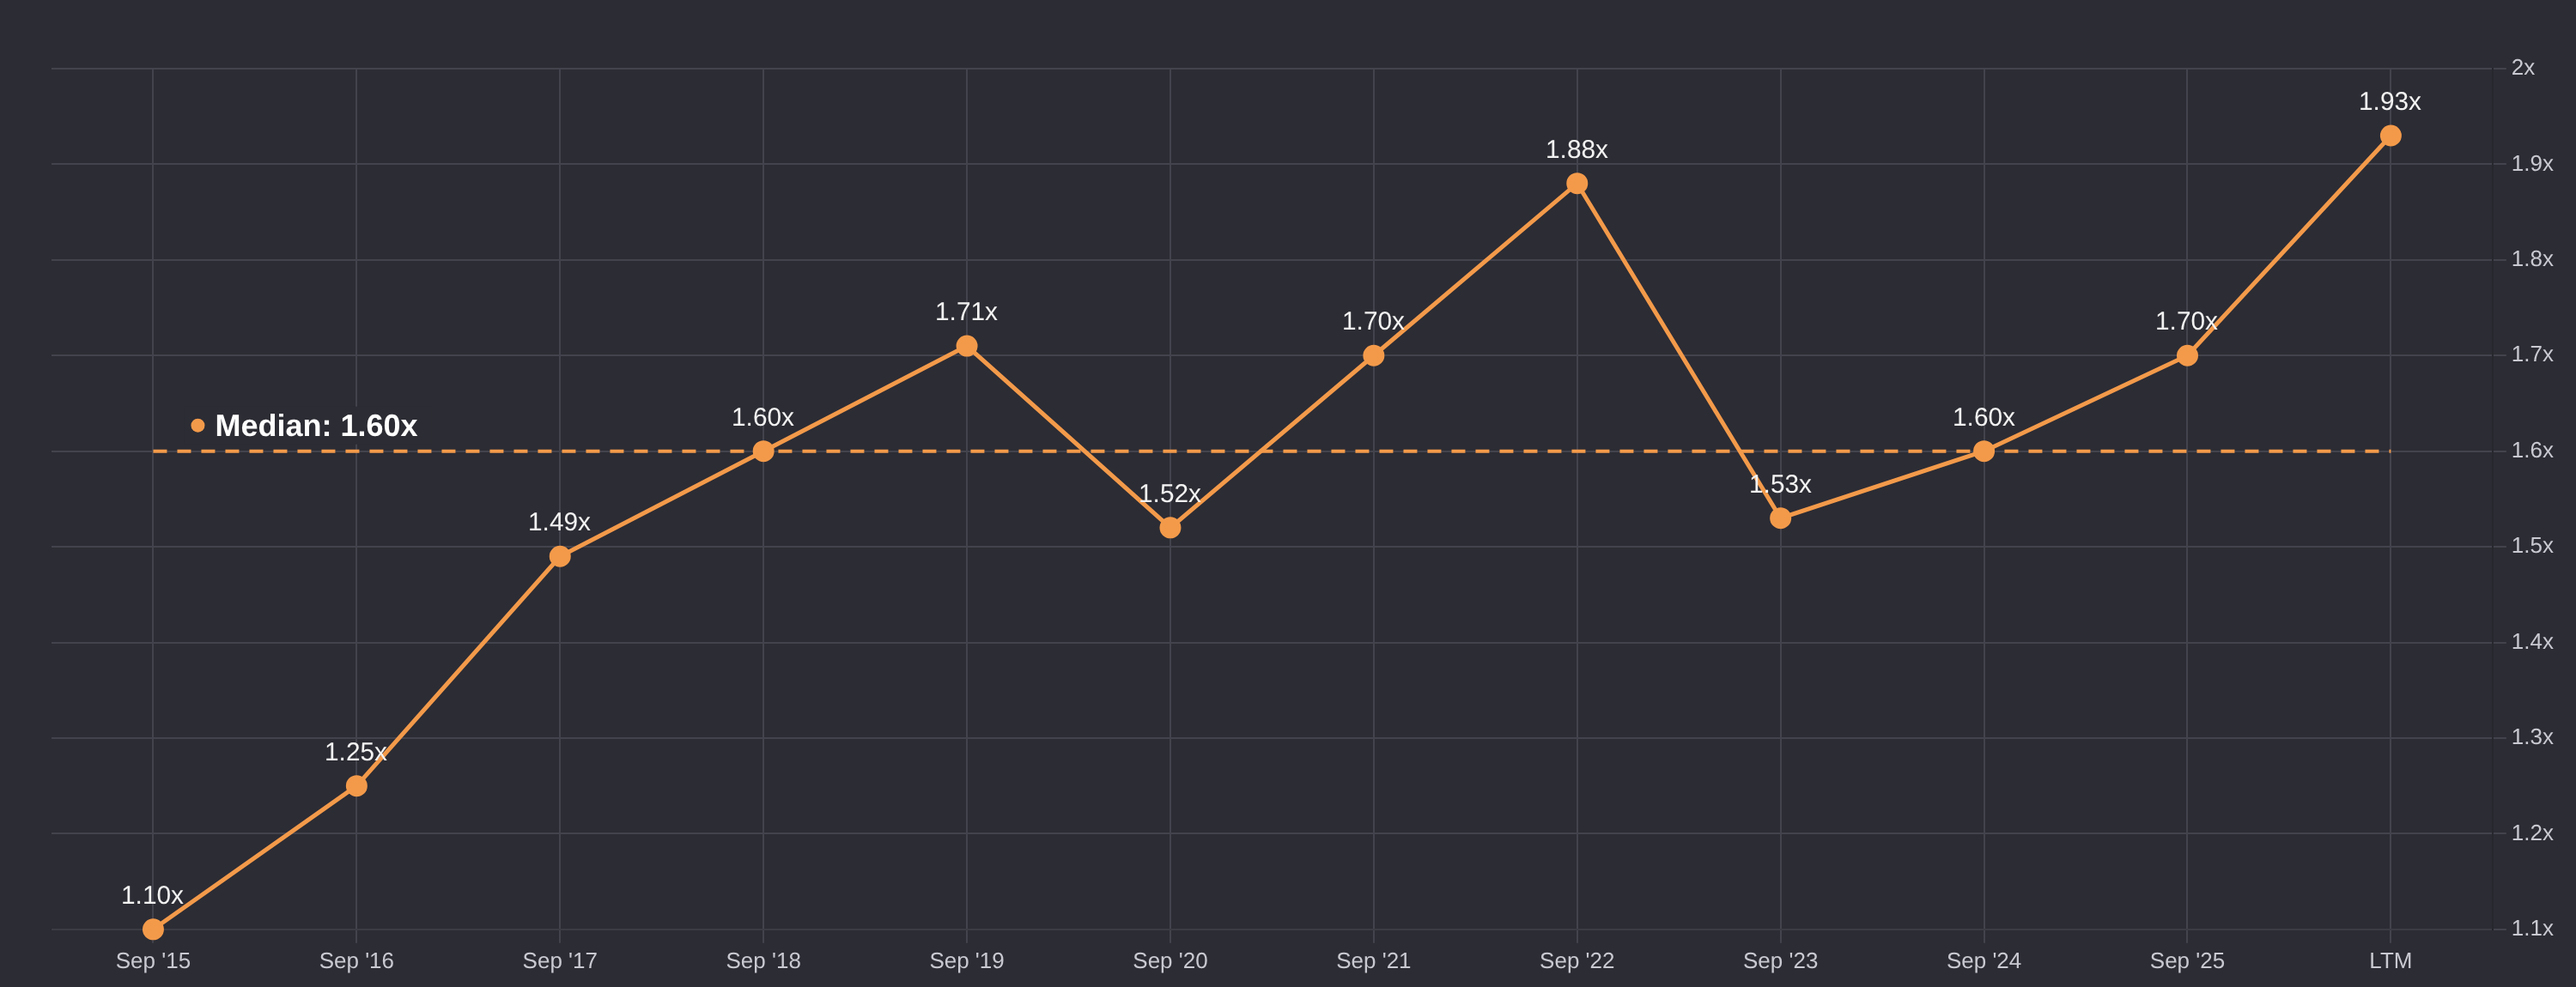
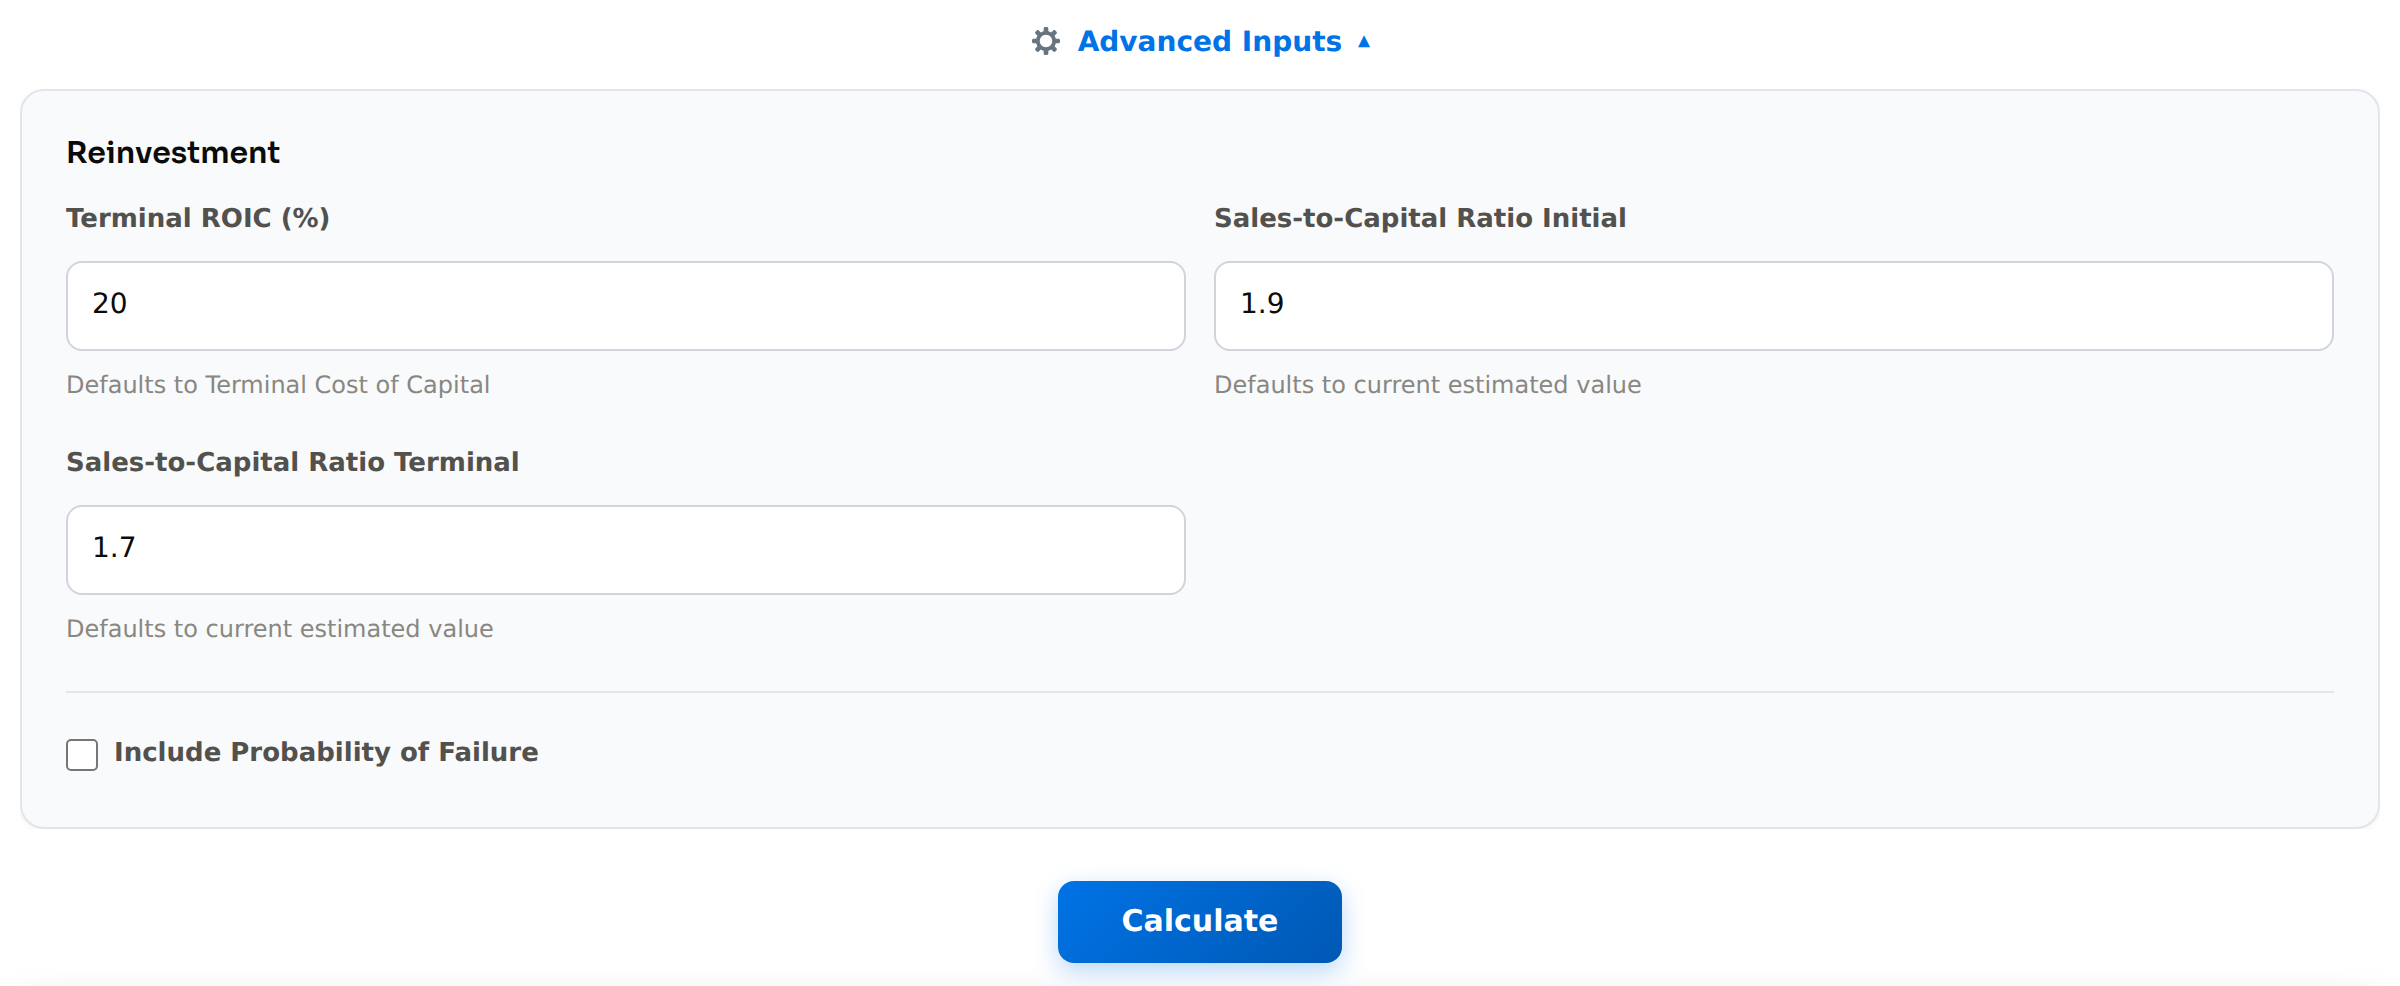
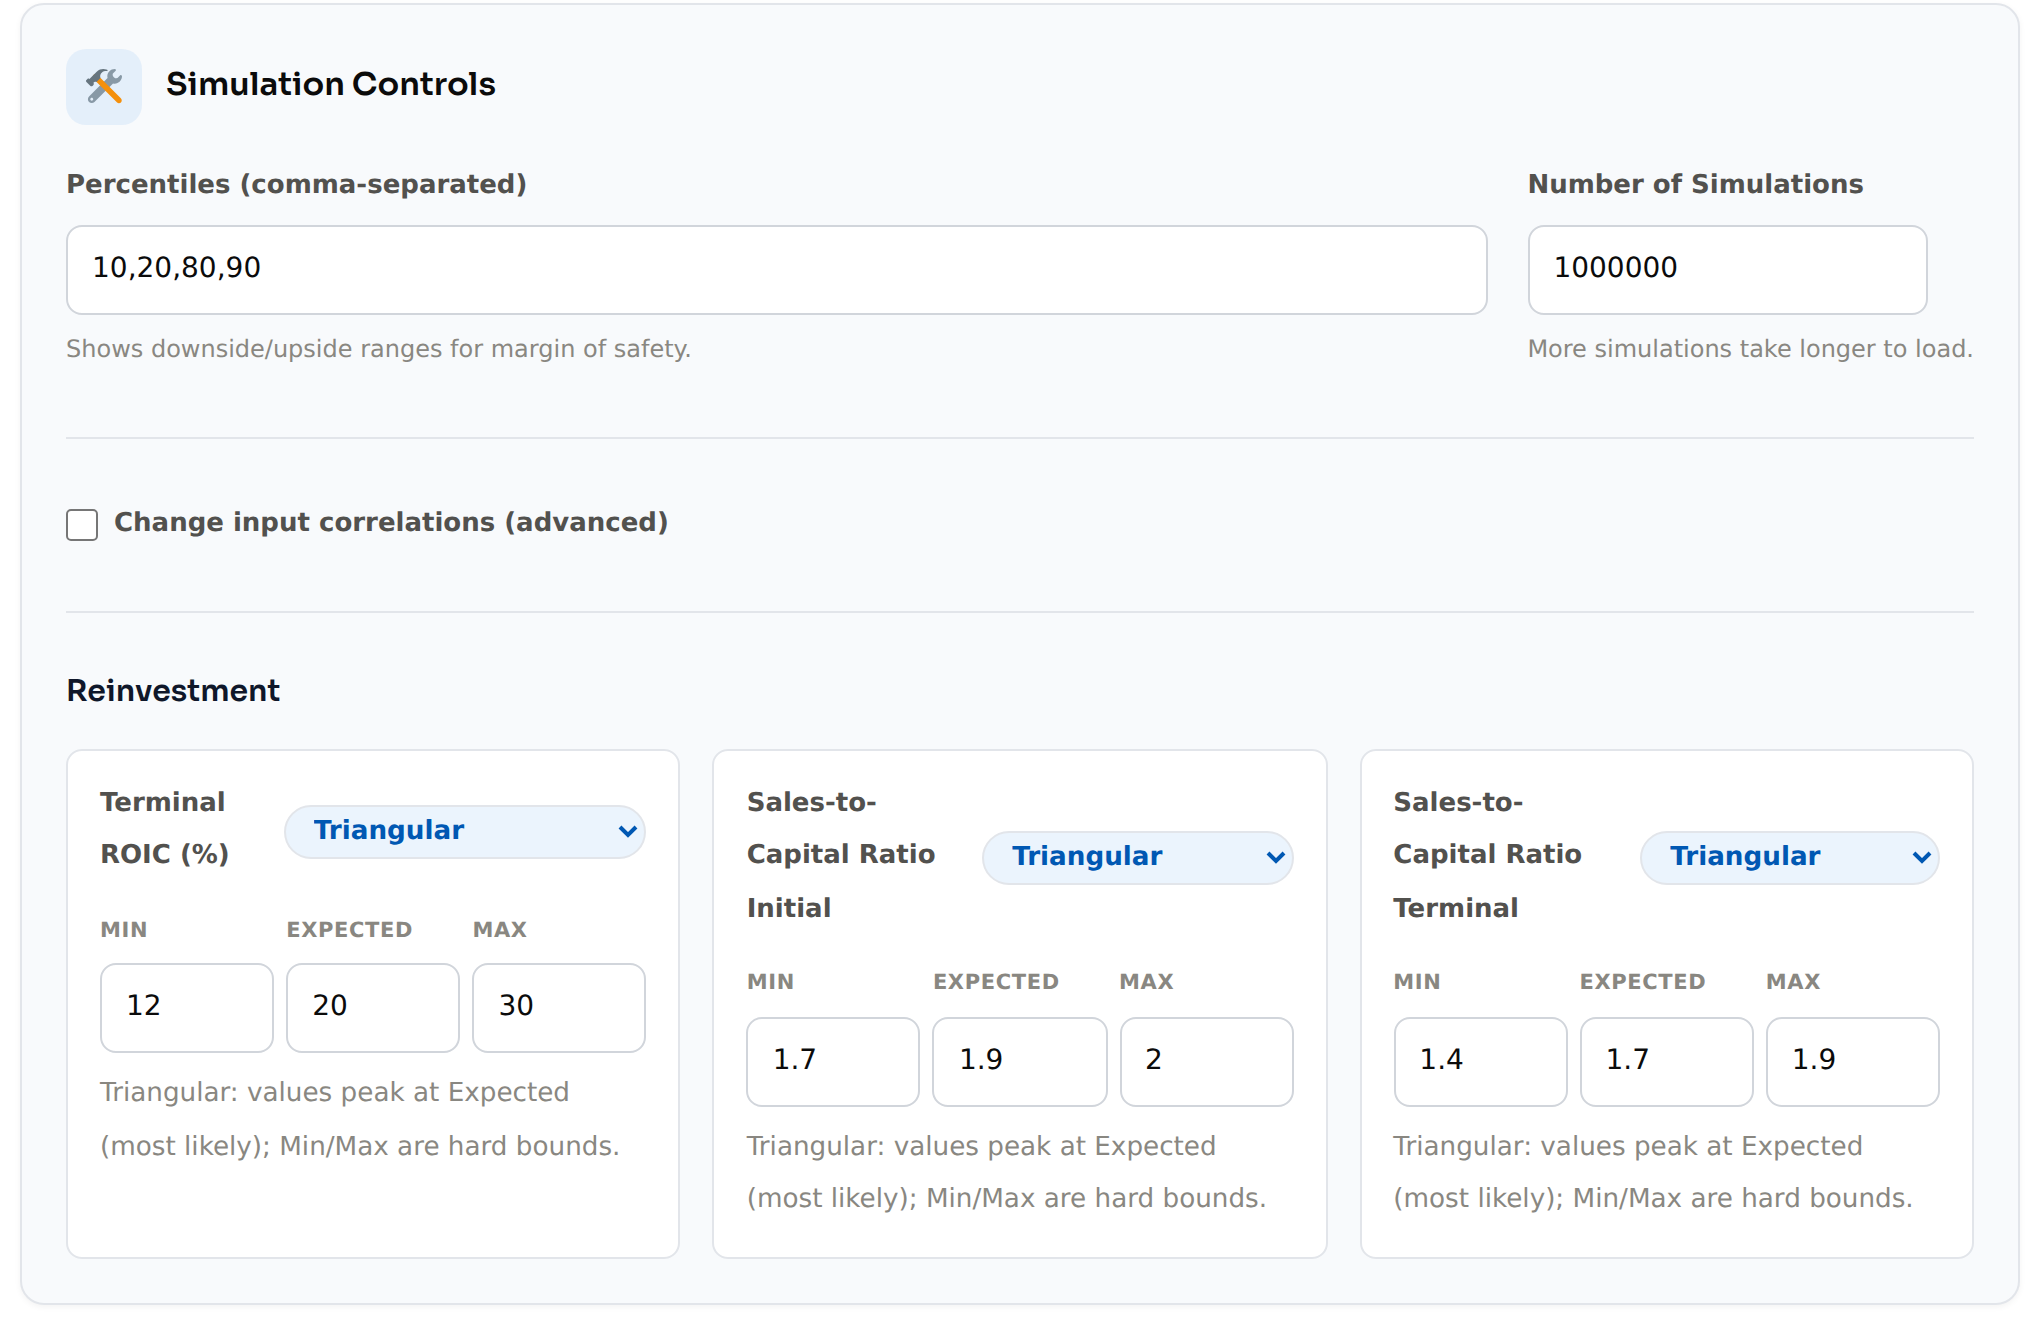
💡 Starts at 1.9 (Bad 1.7 · Good 2.0) and converges to 1.7 (Bad 1.4 · Good 1.9). The last twelve months are 1.93 and the median is 1.6, so Base starts at the current level and drifts back toward history. Invested capital is only about $1.3 billion, since buybacks pushed book equity negative (-$4.1 billion). Little money is needed to grow, so this assumption moves the value less than margin does.
ROIC
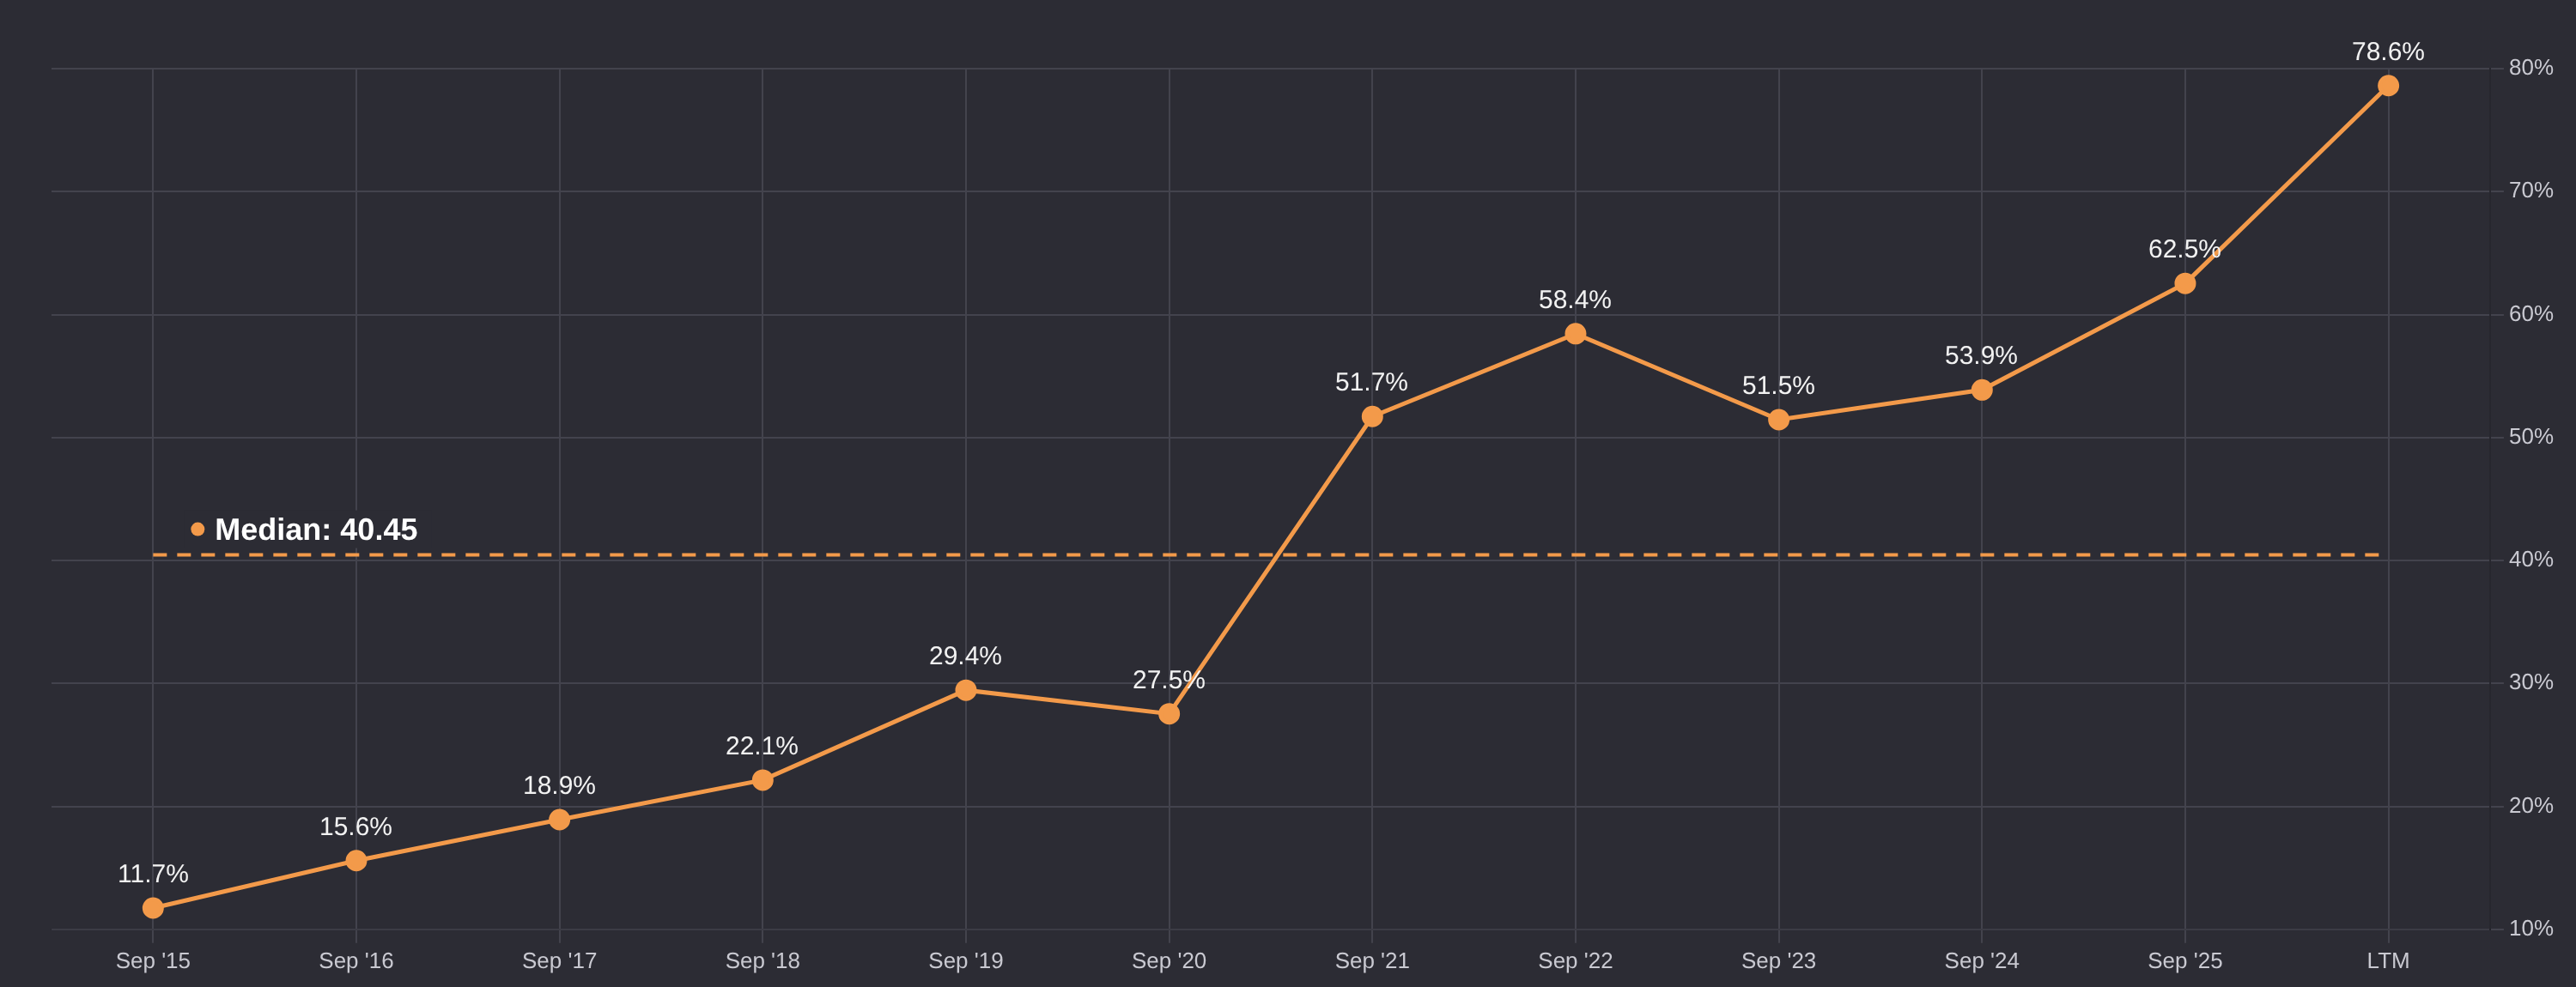
💡 Terminal ROIC 20% (Bad 12% · Good 30%), above the cost of capital. The 5-year average is 55.6% and the median 40.5%, but both are pushed up by the tiny capital base explained above, and a Narrow moat doesn’t support returns that high forever. Base 20% is still more than twice the 9.0% terminal cost of capital: new investment keeps earning well above its cost, but not at today’s level. Bad assumes 12%, barely above the cost of capital. Good keeps 30%, between the median and the average.
Discounted Cash Flows (Weight: 60%)
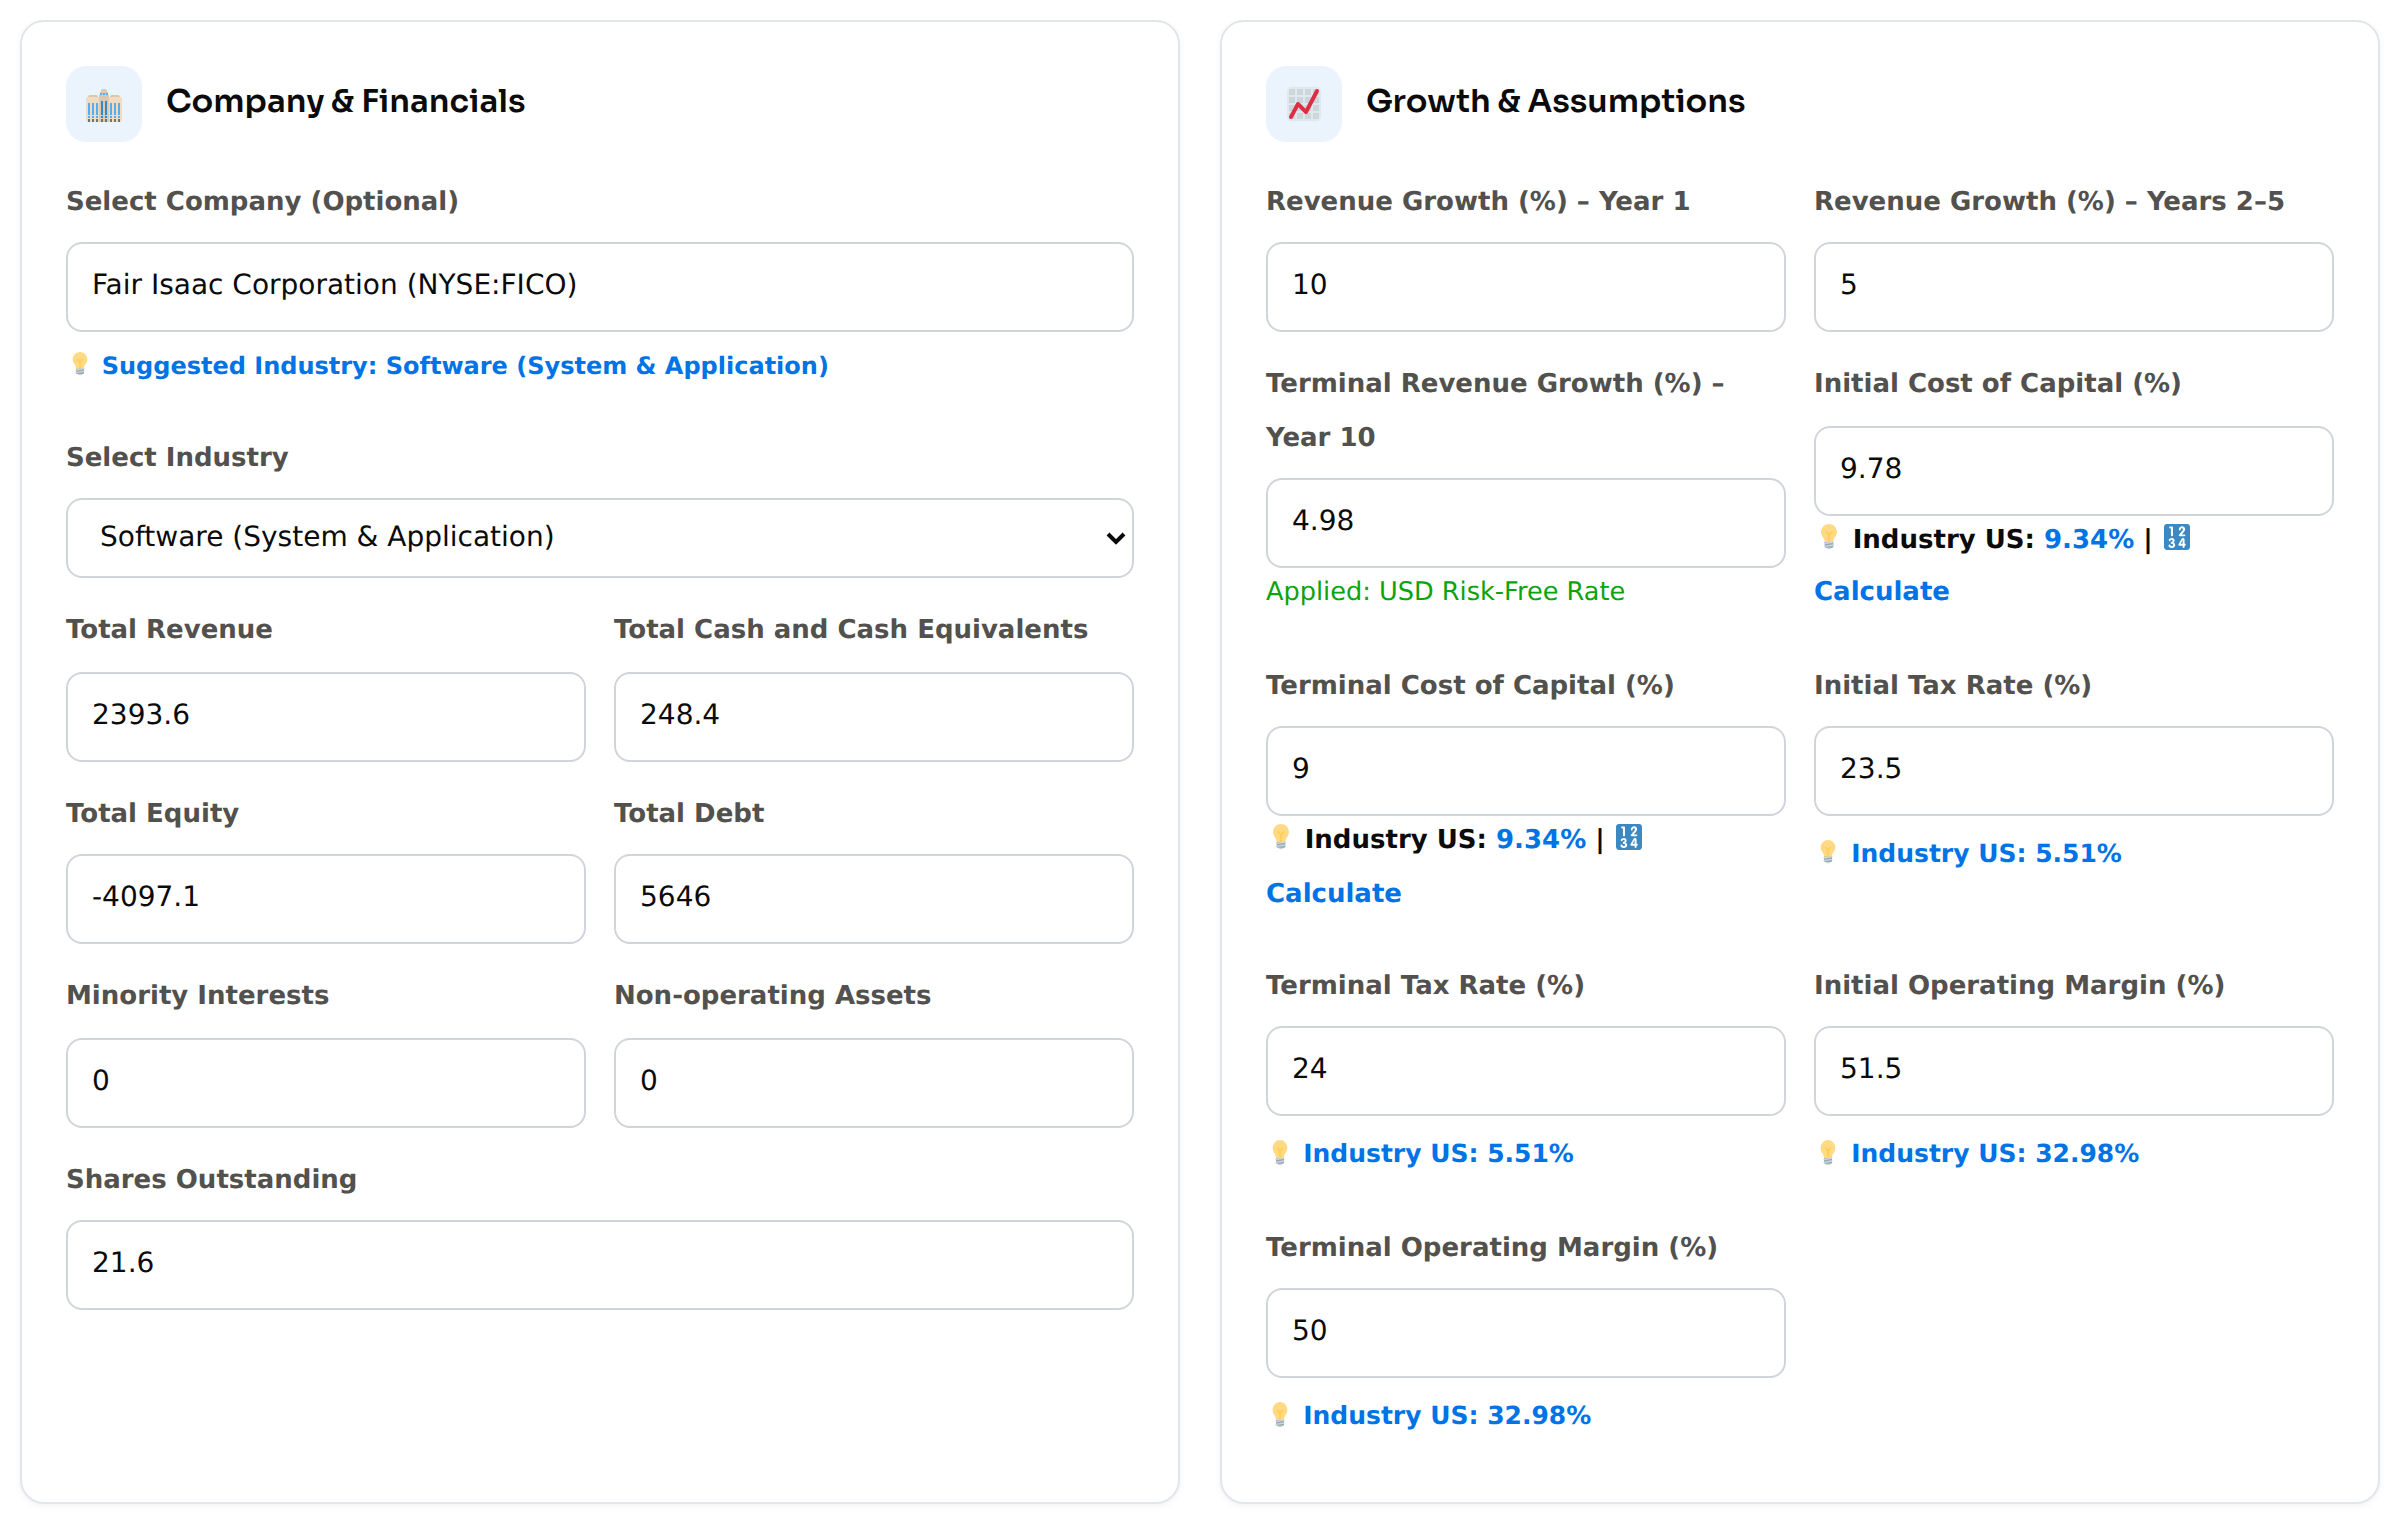
Where the inputs come from:
Total Revenue: trailing twelve months to June 2026 (10-Q).
Cash: cash and equivalents of $248.4 million (June 30, 2026). Unlike the usual convention I don’t add the $56 million of marketable securities, which are non-current and mostly tied to the deferred compensation plan.
Total Equity: book value of -$4,097 million (June 30, 2026), negative because of buybacks.
Total Debt: $5,646 million, as in Cost of Capital.
Non-operating Assets: 0.
Terminal Revenue Growth: the risk-free rate (4.98%), as a proxy for long-term economic growth.
Tax Rate: 23.5% rising to 24%. The effective rate was 23.5% for nine months to June 2026 (10-Q) and 18.8%, 20.1% and 22.4% in fiscal 2025, 2024 and 2023 (10-K). Earlier years were lower because of tax savings on stock awards. I assume those fade with a lower share price and move toward the federal rate plus state taxes.
Shares: 21.6 million, the cover of the 10-Q (July 17, 2026). The $1.5 billion accelerated buyback (ASR) in June delivered 1,055,103 shares, about 80% of the expected total. The remaining $300 million prepayment settles in fiscal Q4, which should retire at least another ~0.26 million shares (about 1.2%) at the June price, and more at today’s lower price. I keep the cover count, so this is a small upside not in the numbers.
Everything else: the assumptions above.
DCF fair value: $630.51.
The Monte Carlo simulation runs 1,000,000 DCFs, drawing each input between its Bad and Good values (Base is the most likely):
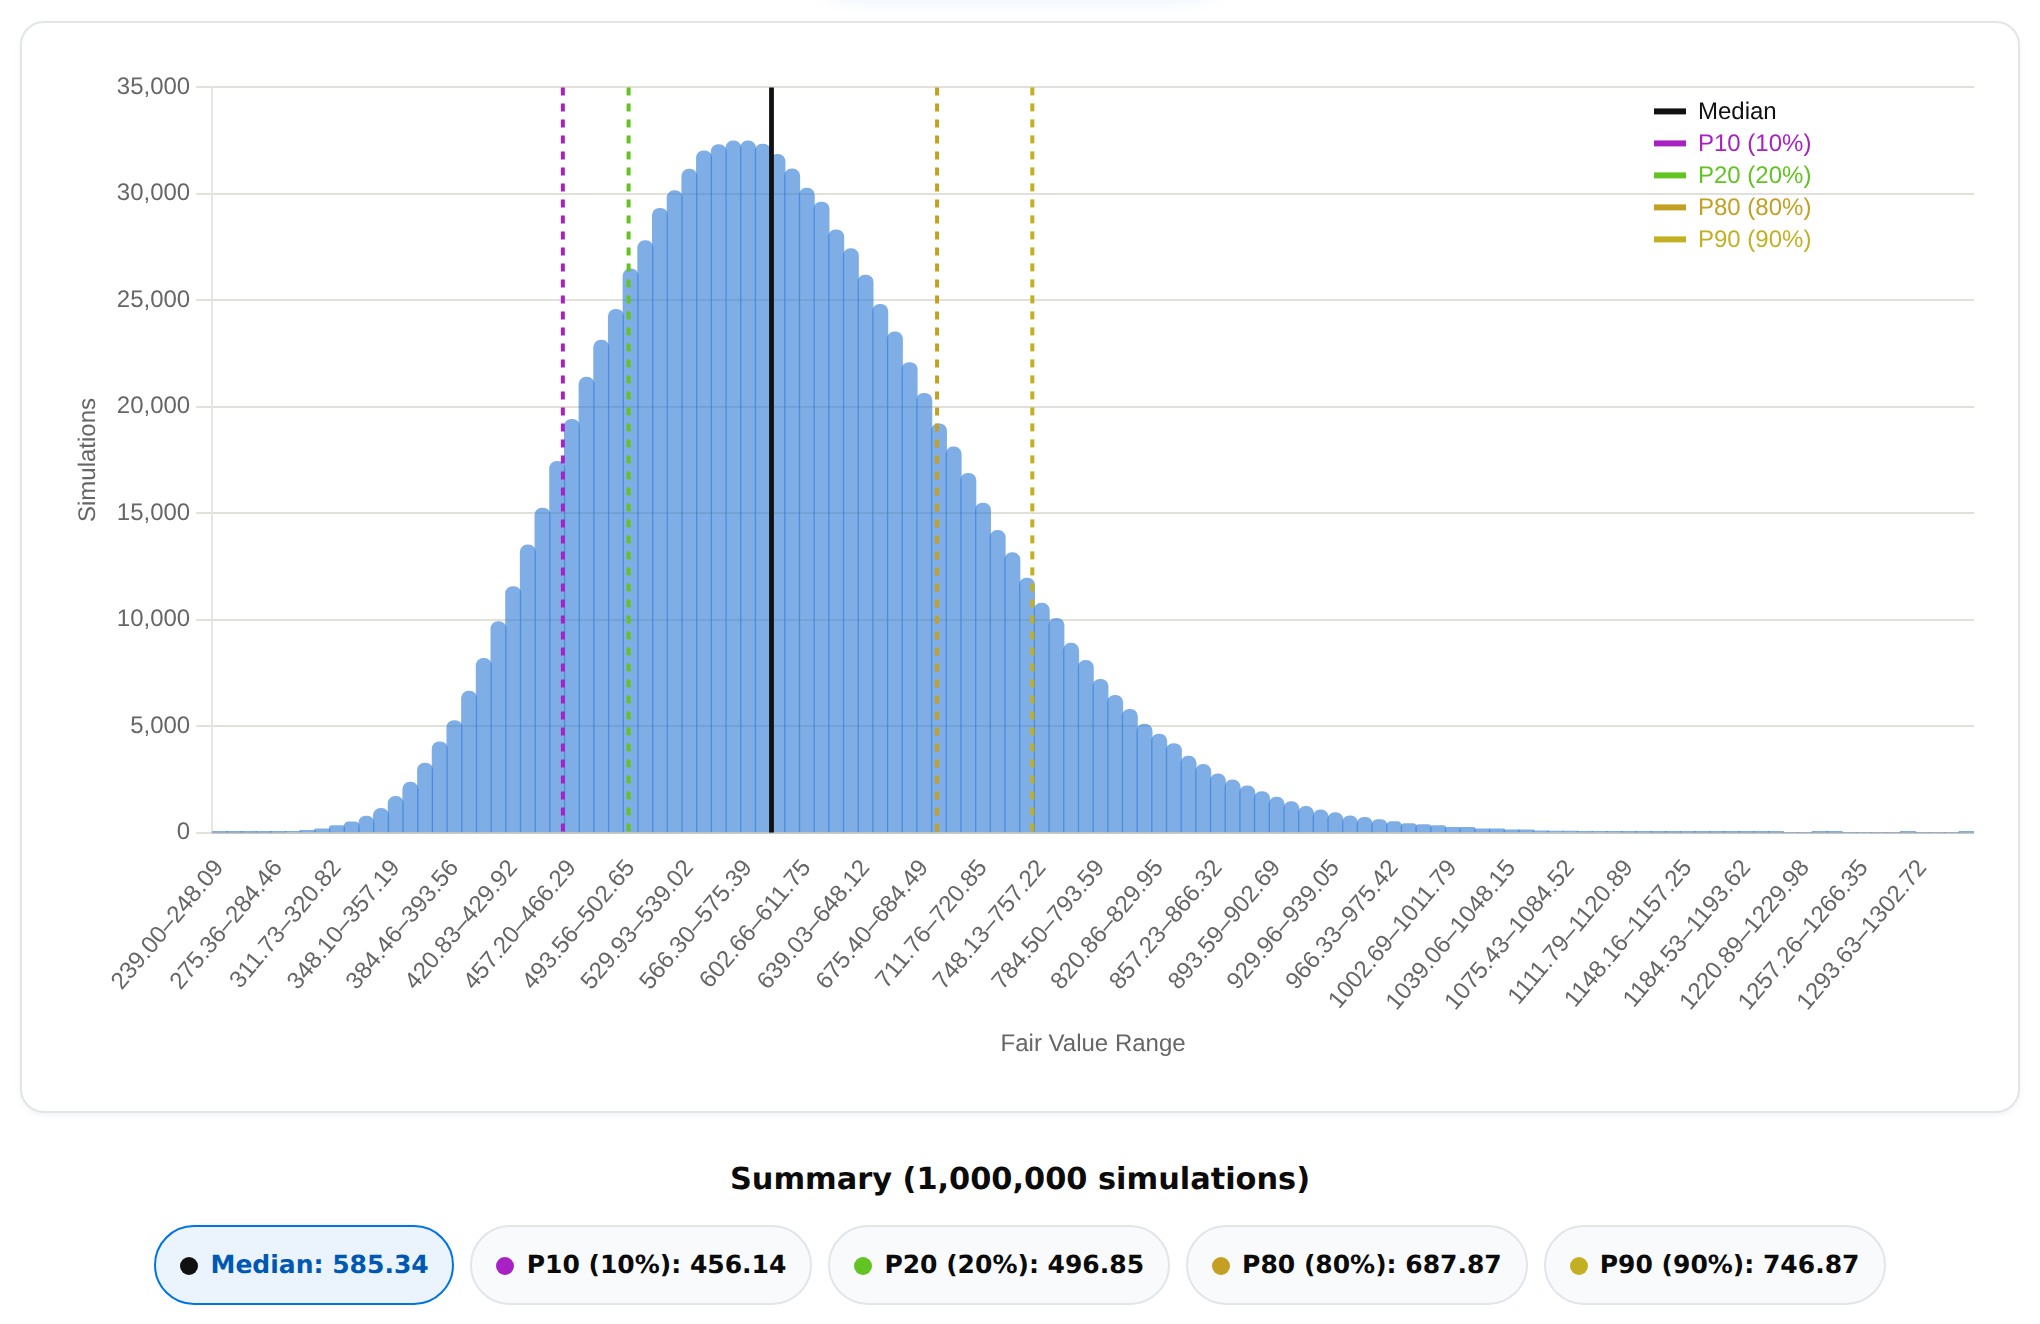
At $711.23, the price is between P80 ($687.87) and P90 ($746.87): FICO looks overvalued on the DCF (roughly 84% of the simulated values are below the price). The simulated median ($585.34) is below the Base DCF because the downside ranges are wider than the upside ones (Bad’s terminal margin is 8 points below Base, Good’s is 5 above) and equity sits behind $5.6 billion of debt.
Try it yourself: DCF – The Fair Value Journal
EPS Growth (Weight: 40%)
TTM EPS: $34.54 reported diluted (TTM to June 2026, 10-K and 10-Q). I use $34.22 of core EPS, which removes about $15 million of other income (dividends and investment gains on the deferred compensation plan) that is not operating profit. Core tax is the 23.5% effective rate. The 21.6 million share count is already after the large buybacks of fiscal 2026, while TTM EPS is earned on about 23.5 million diluted shares. So the EPS CAGR below includes about 1.7 points a year of one-off buyback effect: on a consistent share base it would be about 6.5%.
Revenue Growth (CAGR)
1 Year | 3 Years | 5 Years | 10 Years |
|---|---|---|---|
15.91% | 13.07% | 8.99% | 9.03% |
💡 6.0% (Bad 0.8% · Good 10.4%). This is the compound rate of my DCF path (Year 1 at 10%, then 5% a year), against 9.0% for the last 5 and 10 years. Good matches the 10-year rate and Bad is almost flat.
Shares Outstanding (CAGR)
1 Year | 3 Years | 5 Years | 10 Years |
|---|---|---|---|
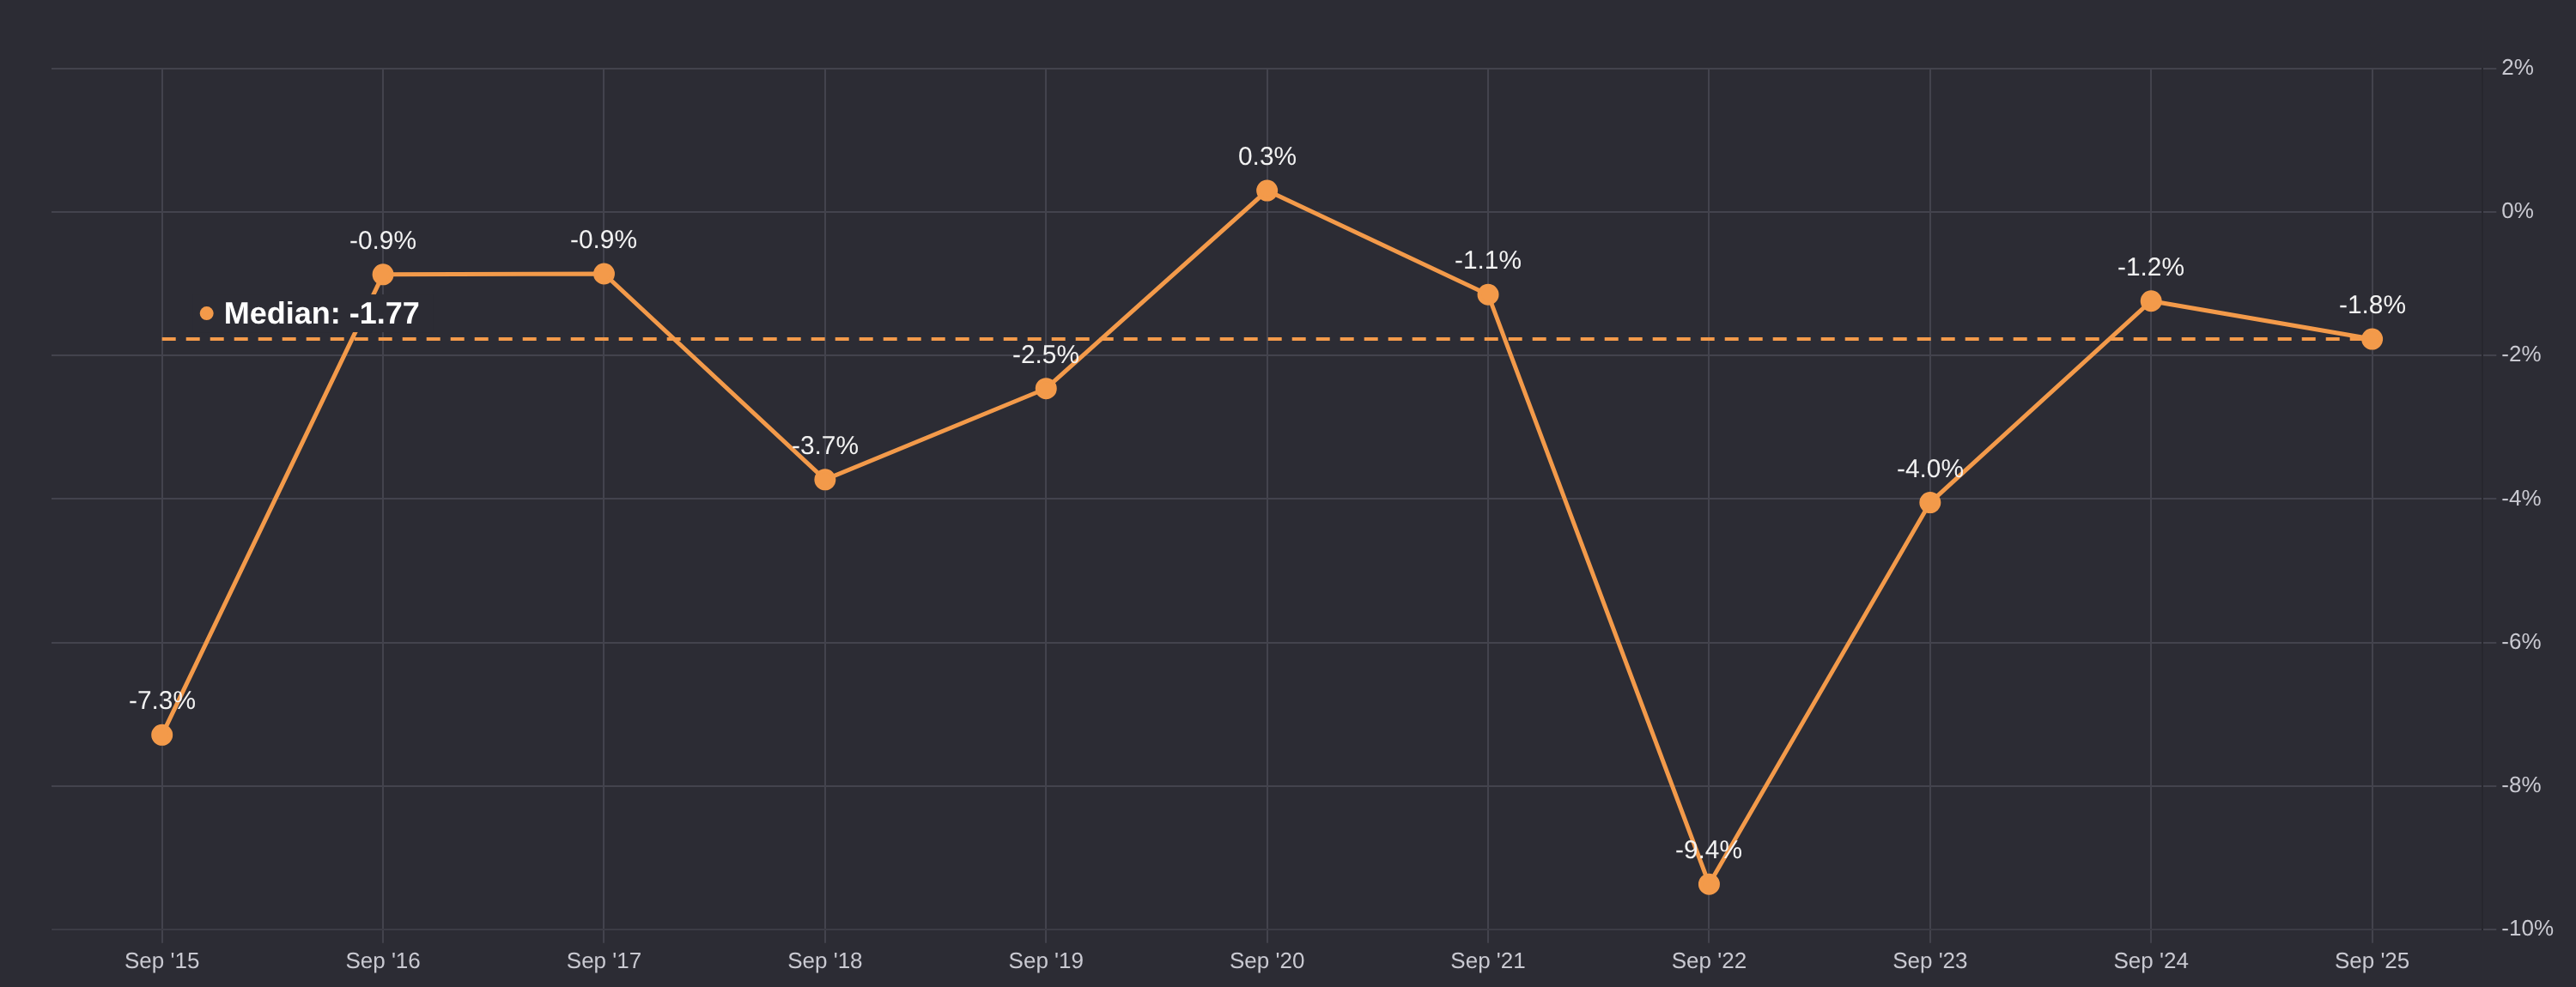
-1.77% | -2.36% | -3.57% | -2.56% |
💡 -2.0% a year (Bad -0.5% · Good -3.5%). The 5-year pace is -3.6%, but debt is about 4.5x EBIT plus D&A (my calculation; the credit agreement defines its own EBITDA) and the limit drops from 4.5x to 4.0x on December 31, 2026. Management plans to prioritise paying debt down (Q3 call), so buybacks should be slower for a while. Good has free cash flow going back to buybacks at a low share price.
Net Profit Margin (Average)
| 1 Year | 3 Years | 5 Years | 10 Years |
|---|---|---|---|---|
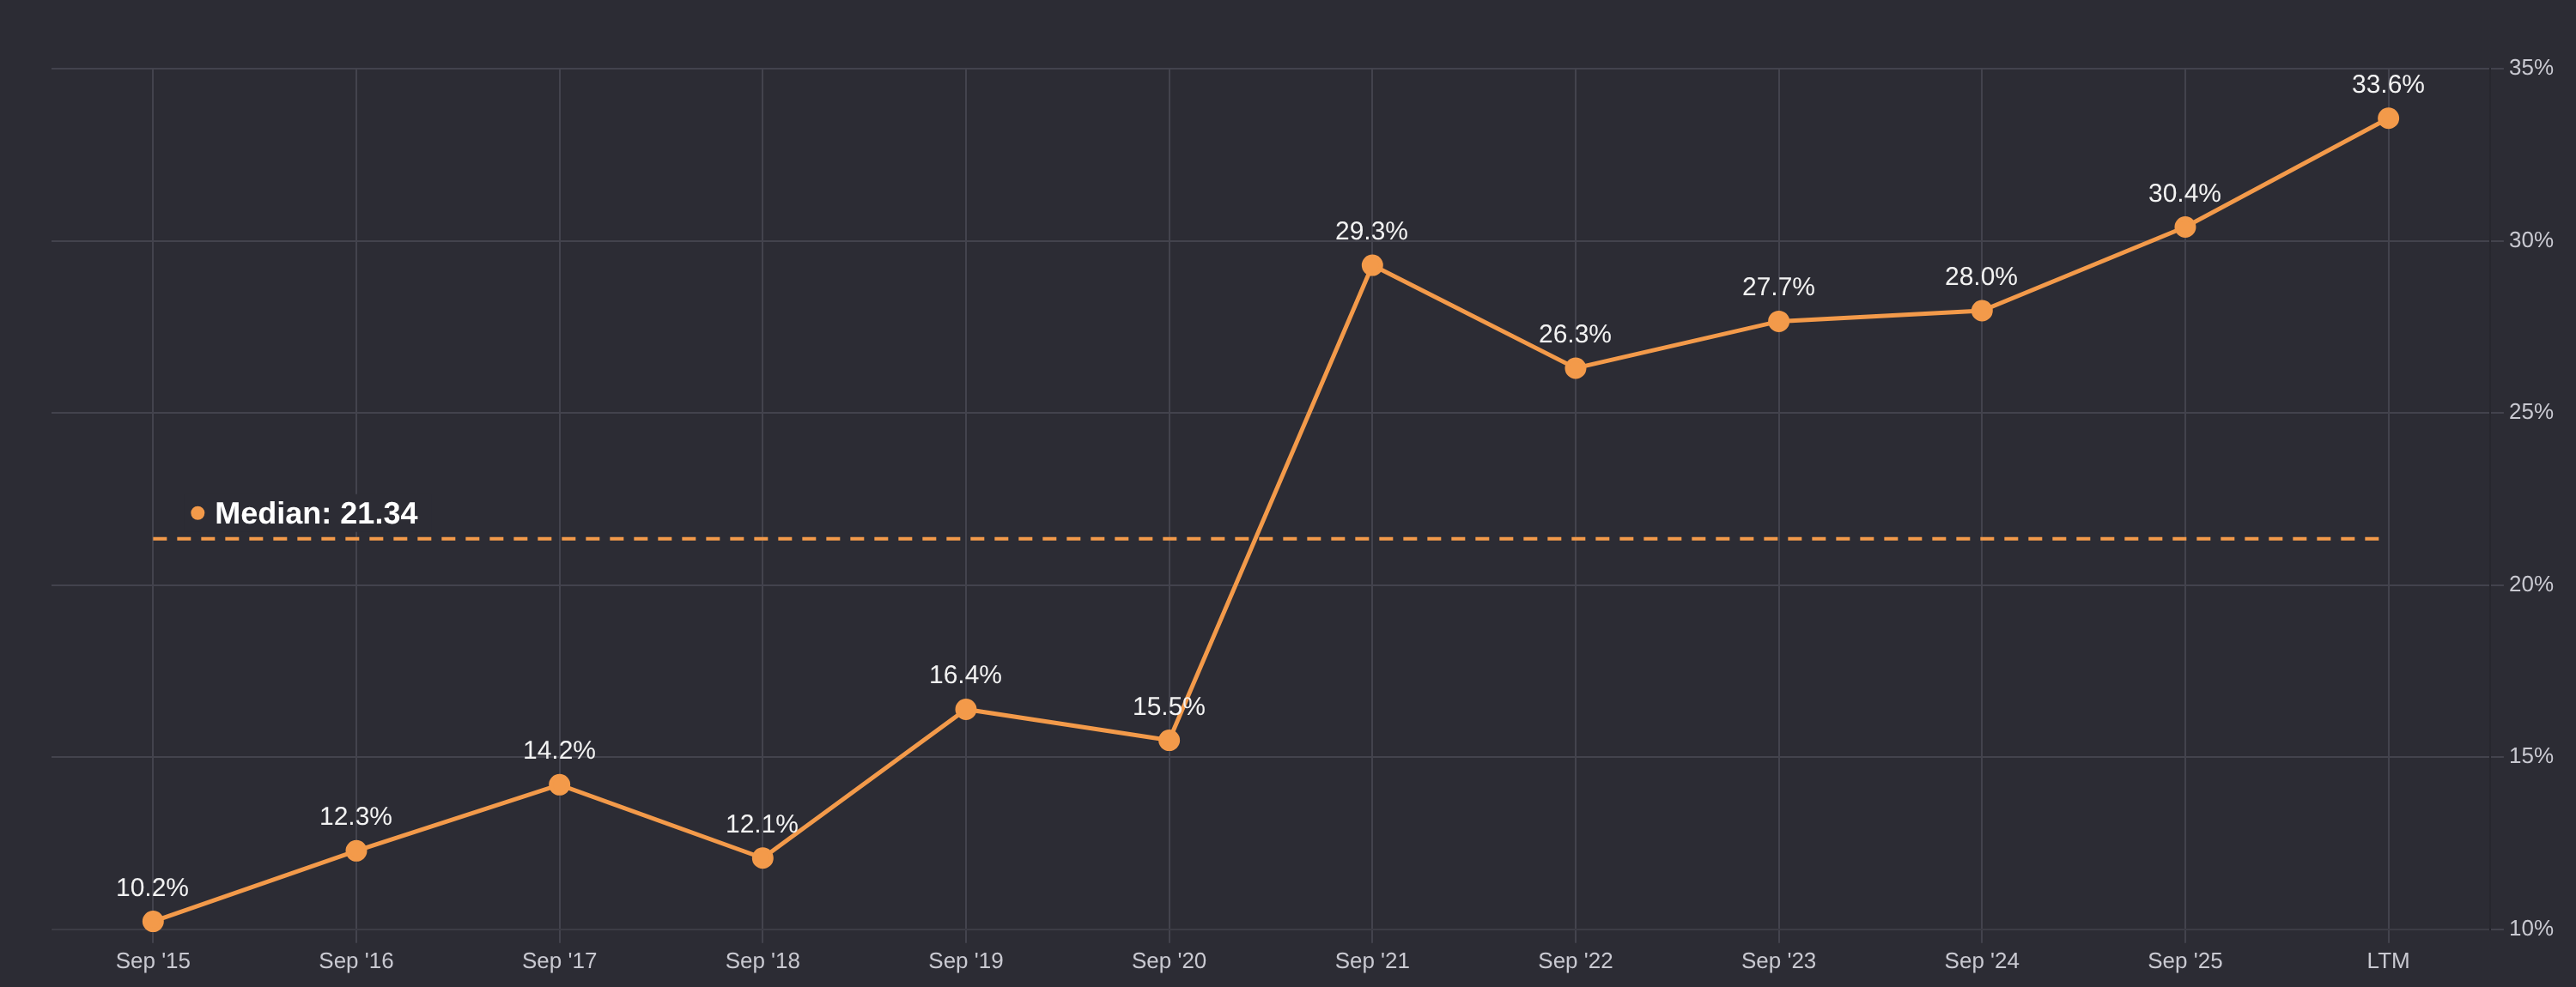
Reported | 32.75% | 30.32% | 29.58% | 22.20% |
Ex. non-operating items | 30.40% | 28.68% | 28.33% | 21.20% |
💡 31% in year 5 (Bad 21% · Good 38%). Fiscal 2026 guidance implies about 33.6% (GAAP net income of $850 million on $2.53 billion). Base goes lower because the margin on operations falls to 50% and interest on debt is still large: year-5 revenue of $3.2 billion at a 50% margin is $1.6 billion of operating income, less about $0.27 billion of interest on about $4.5 billion of debt at about 6%, taxed at 24%. That is the same debt path behind the 9.0% terminal cost of capital. Bad has 42% on $2.5 billion of revenue, with interest on the full $5.6 billion. Good has 55% on $3.9 billion with debt mostly repaid.
P/E ratio (Average)
1 Year | 3 Years | 5 Years | 10 Years |
|---|---|---|---|
69.40 | 58.38 | 48.26 | 43.69 |
💡 22 in year 5 (Bad 14 · Good 30). The current P/E is 20.8 (core EPS), and the 5-year average is 48.3. Those averages came from a time of fast growth and growing pricing power, so I don’t use them. For a business growing EPS at 8% with a narrowing moat, 22 is close to today’s level. Good is 30, the lowest of the 10 yearly averages, and Bad is 14 for a business that has lost its pricing power.
Scenarios (5 years)
| Bad | Base | Good |
|---|---|---|---|
Revenue growth (CAGR) | 0.8% | 6.0% | 10.4% |
Net profit margin | 21% | 31% | 38% |
Shares outstanding (CAGR) | -0.5% | -2.0% | -3.5% |
P/E | 14 | 22 | 30 |
EPS in year 5 | $24.83 | $50.86 | $82.53 |
EPS CAGR | -6.21% | 8.25% | 19.25% |
The Base scenario, discounted at the 9.78% cost of capital:
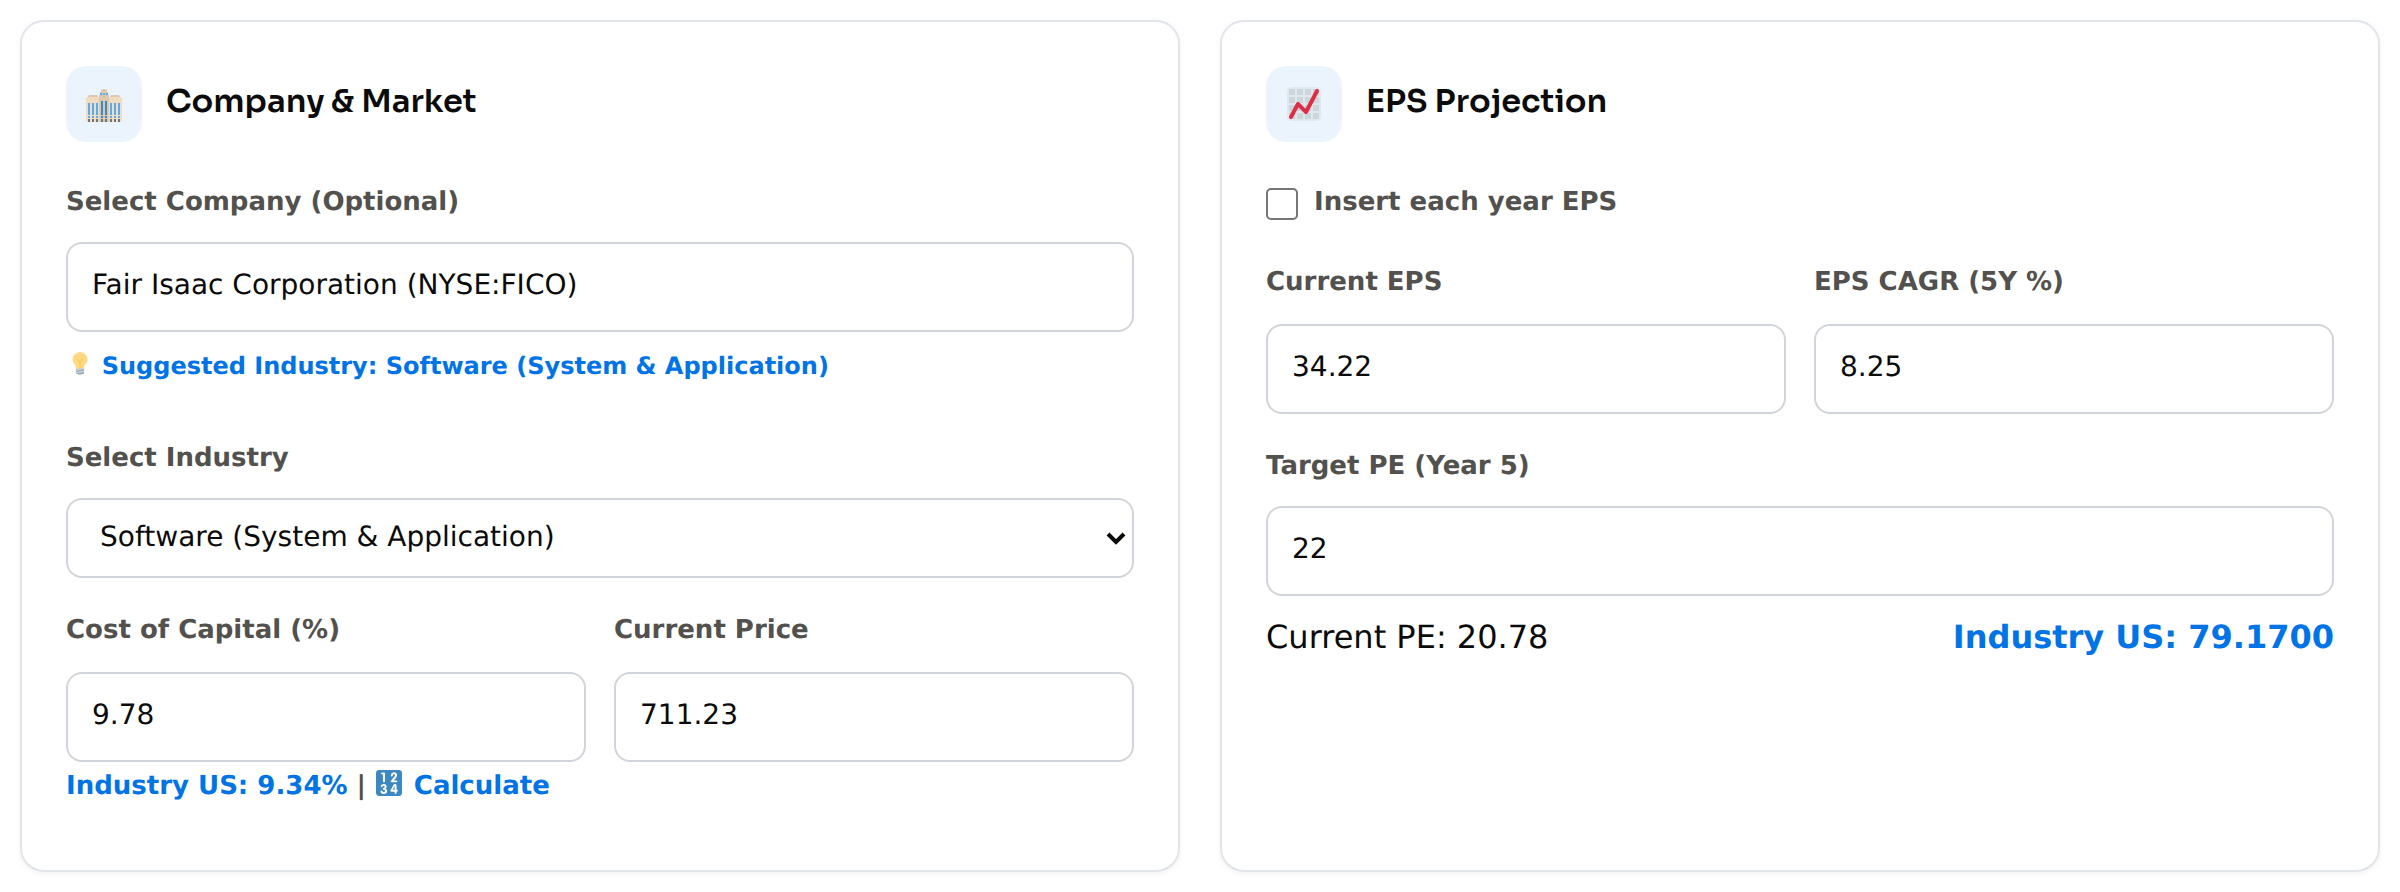
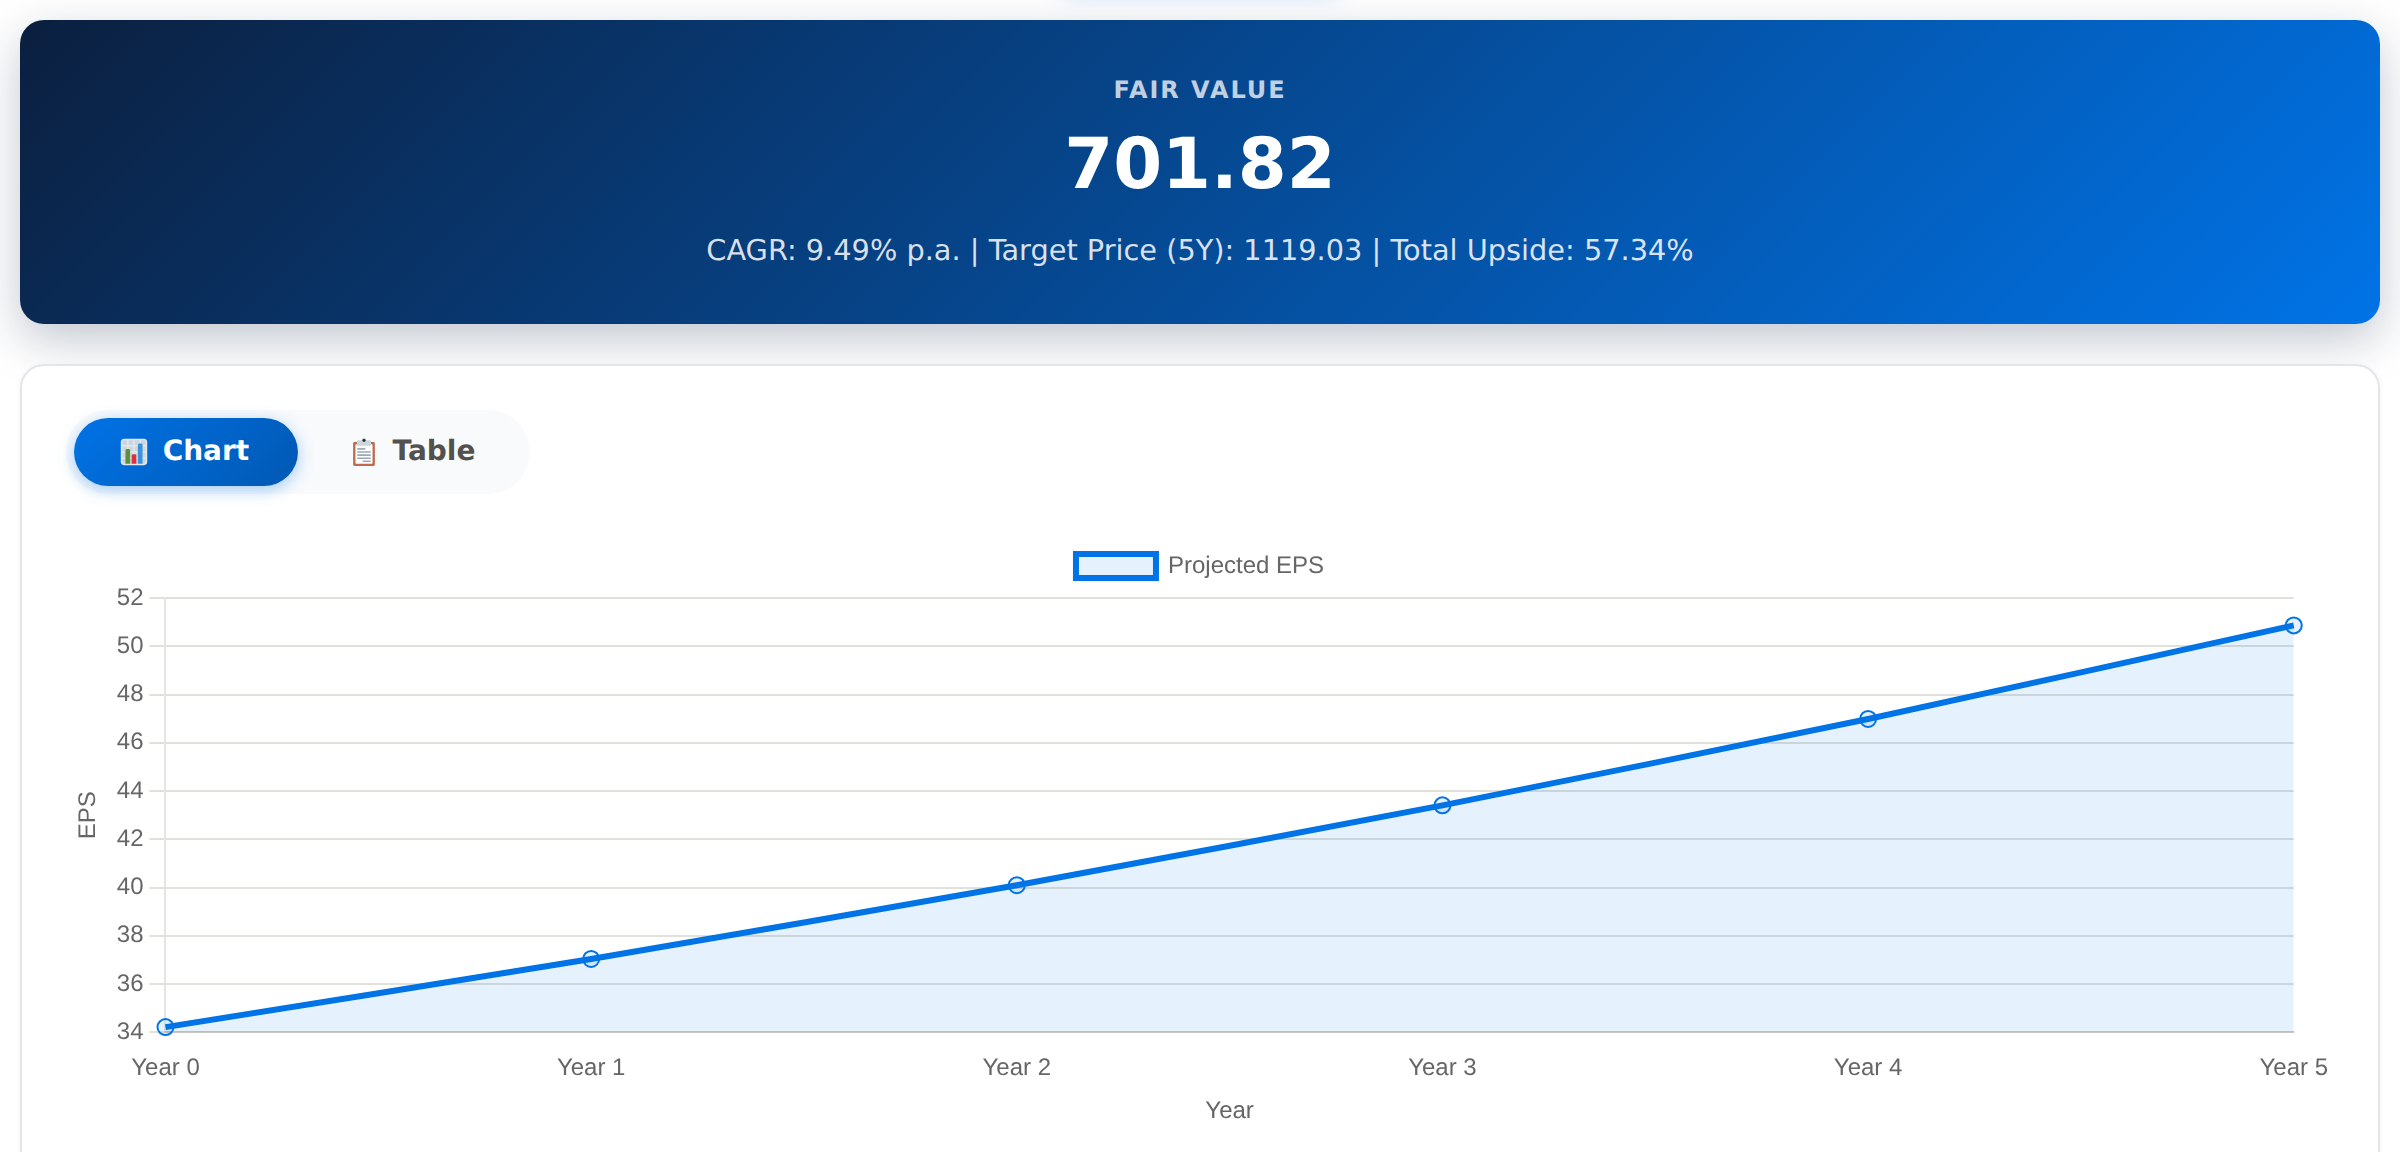
EPS fair value: $701.82.
Monte Carlo between the Bad and Good scenarios:
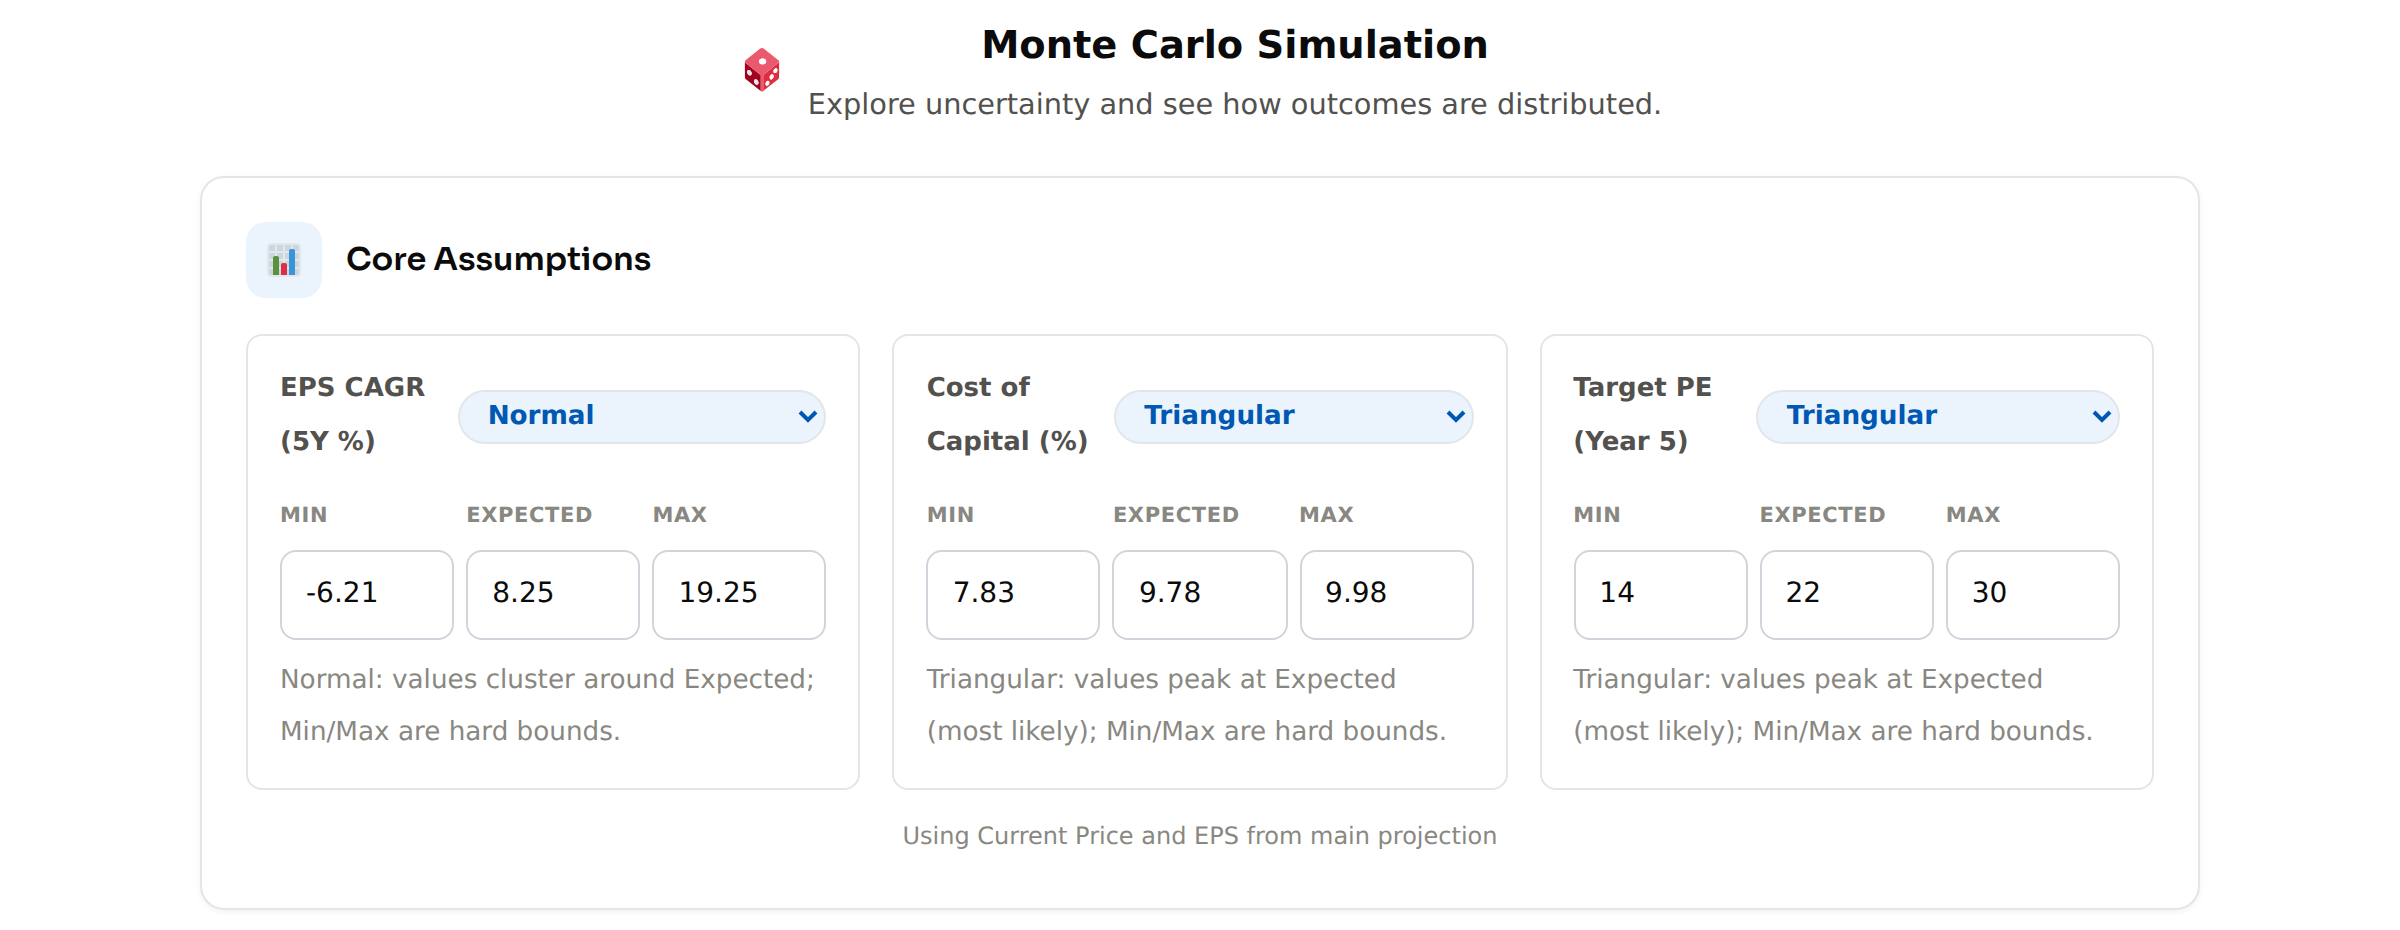
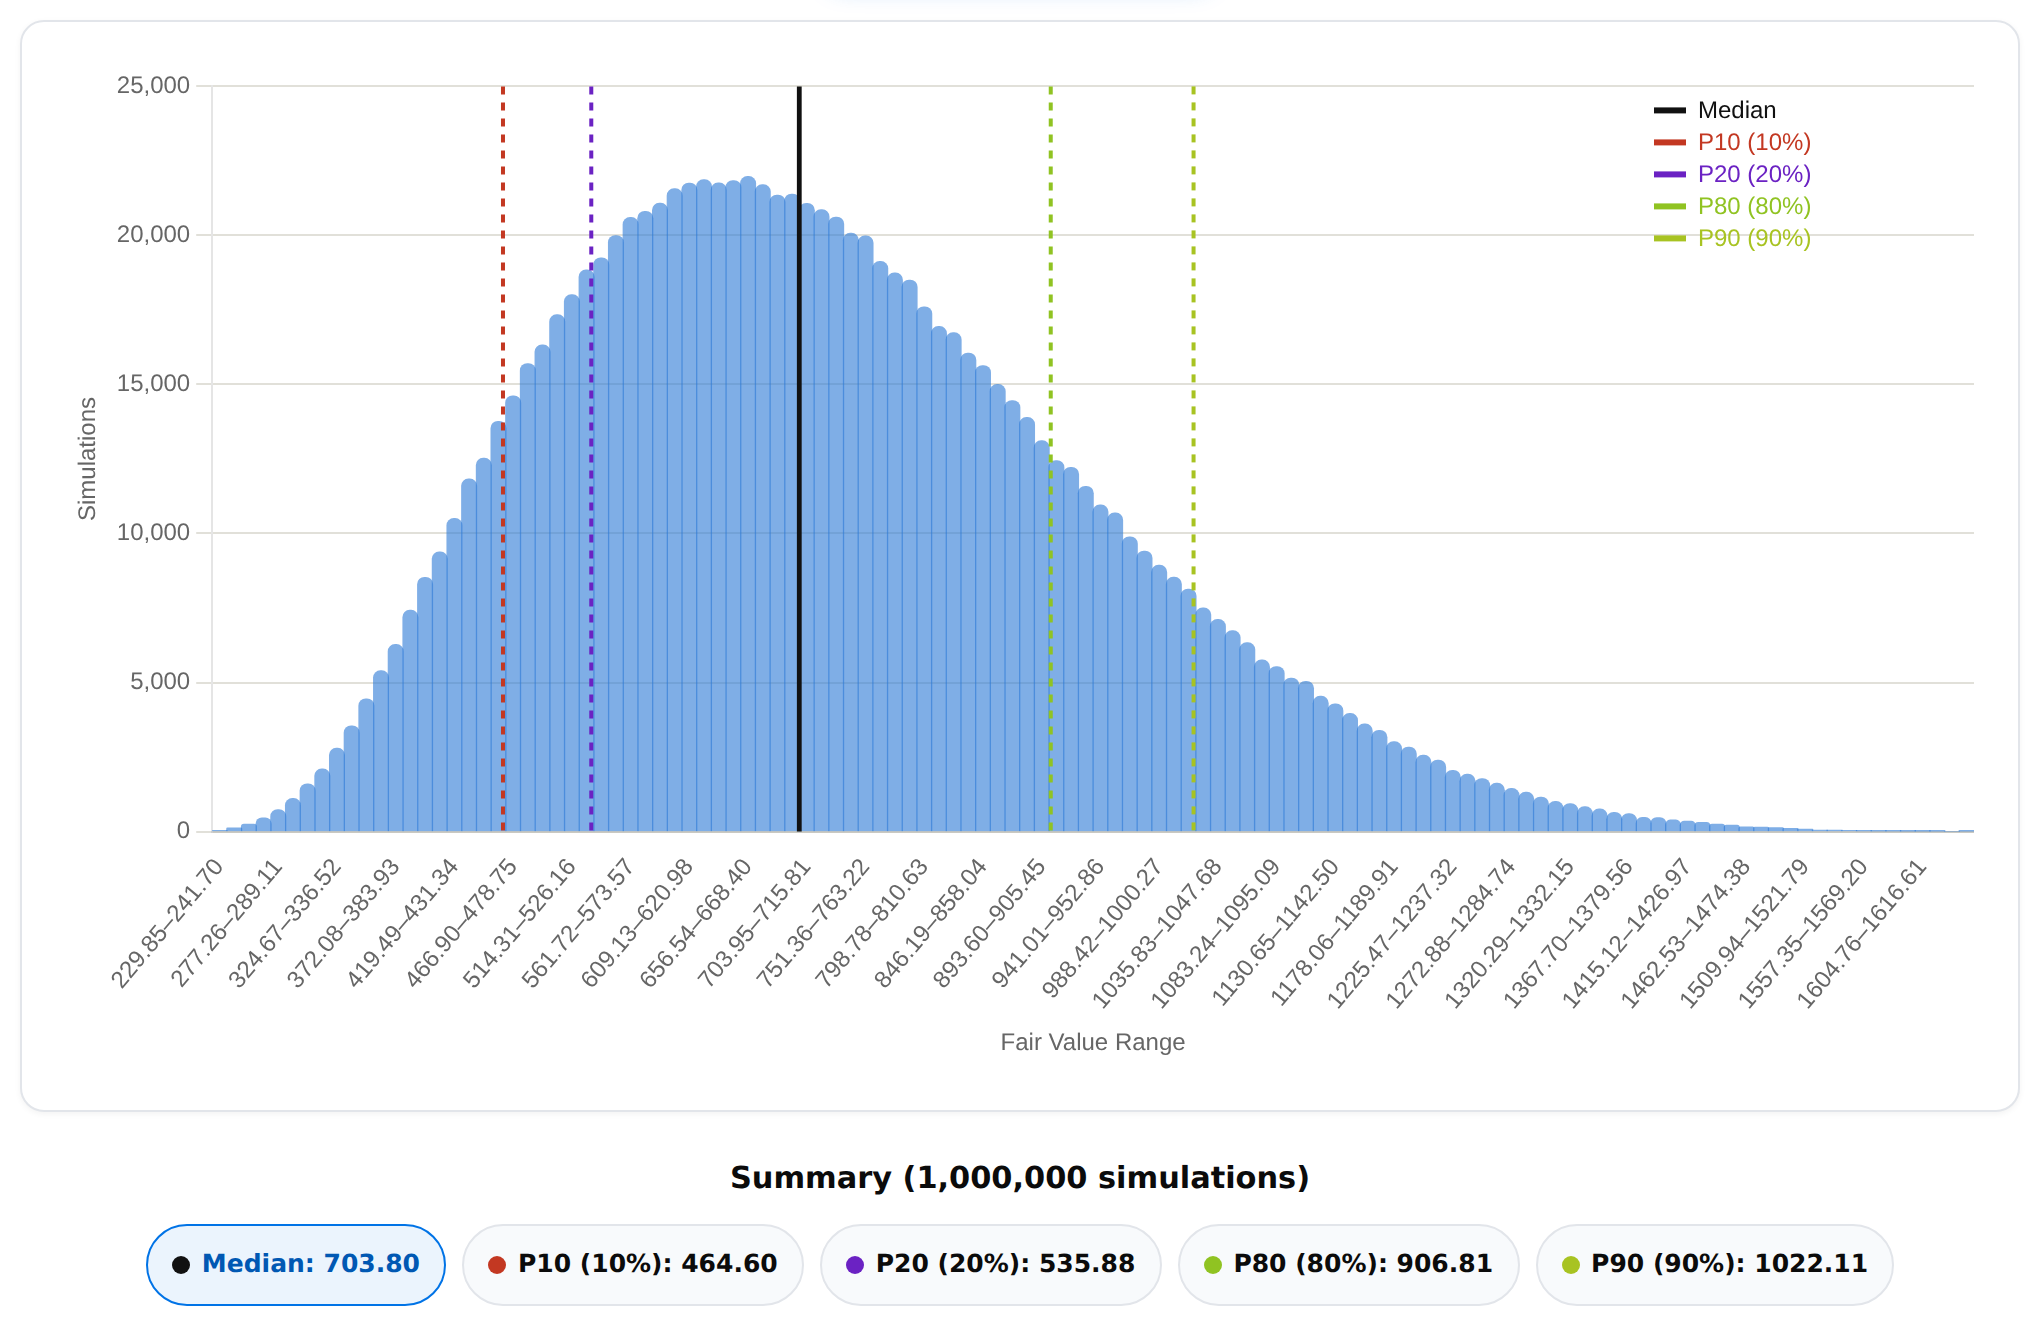
At $711.23, the price is almost exactly at the median ($703.80): FICO looks fairly valued on EPS (about half of the simulated values are below the price).
Try it yourself: EPS Growth – The Fair Value Journal
EPS Scenario Returns
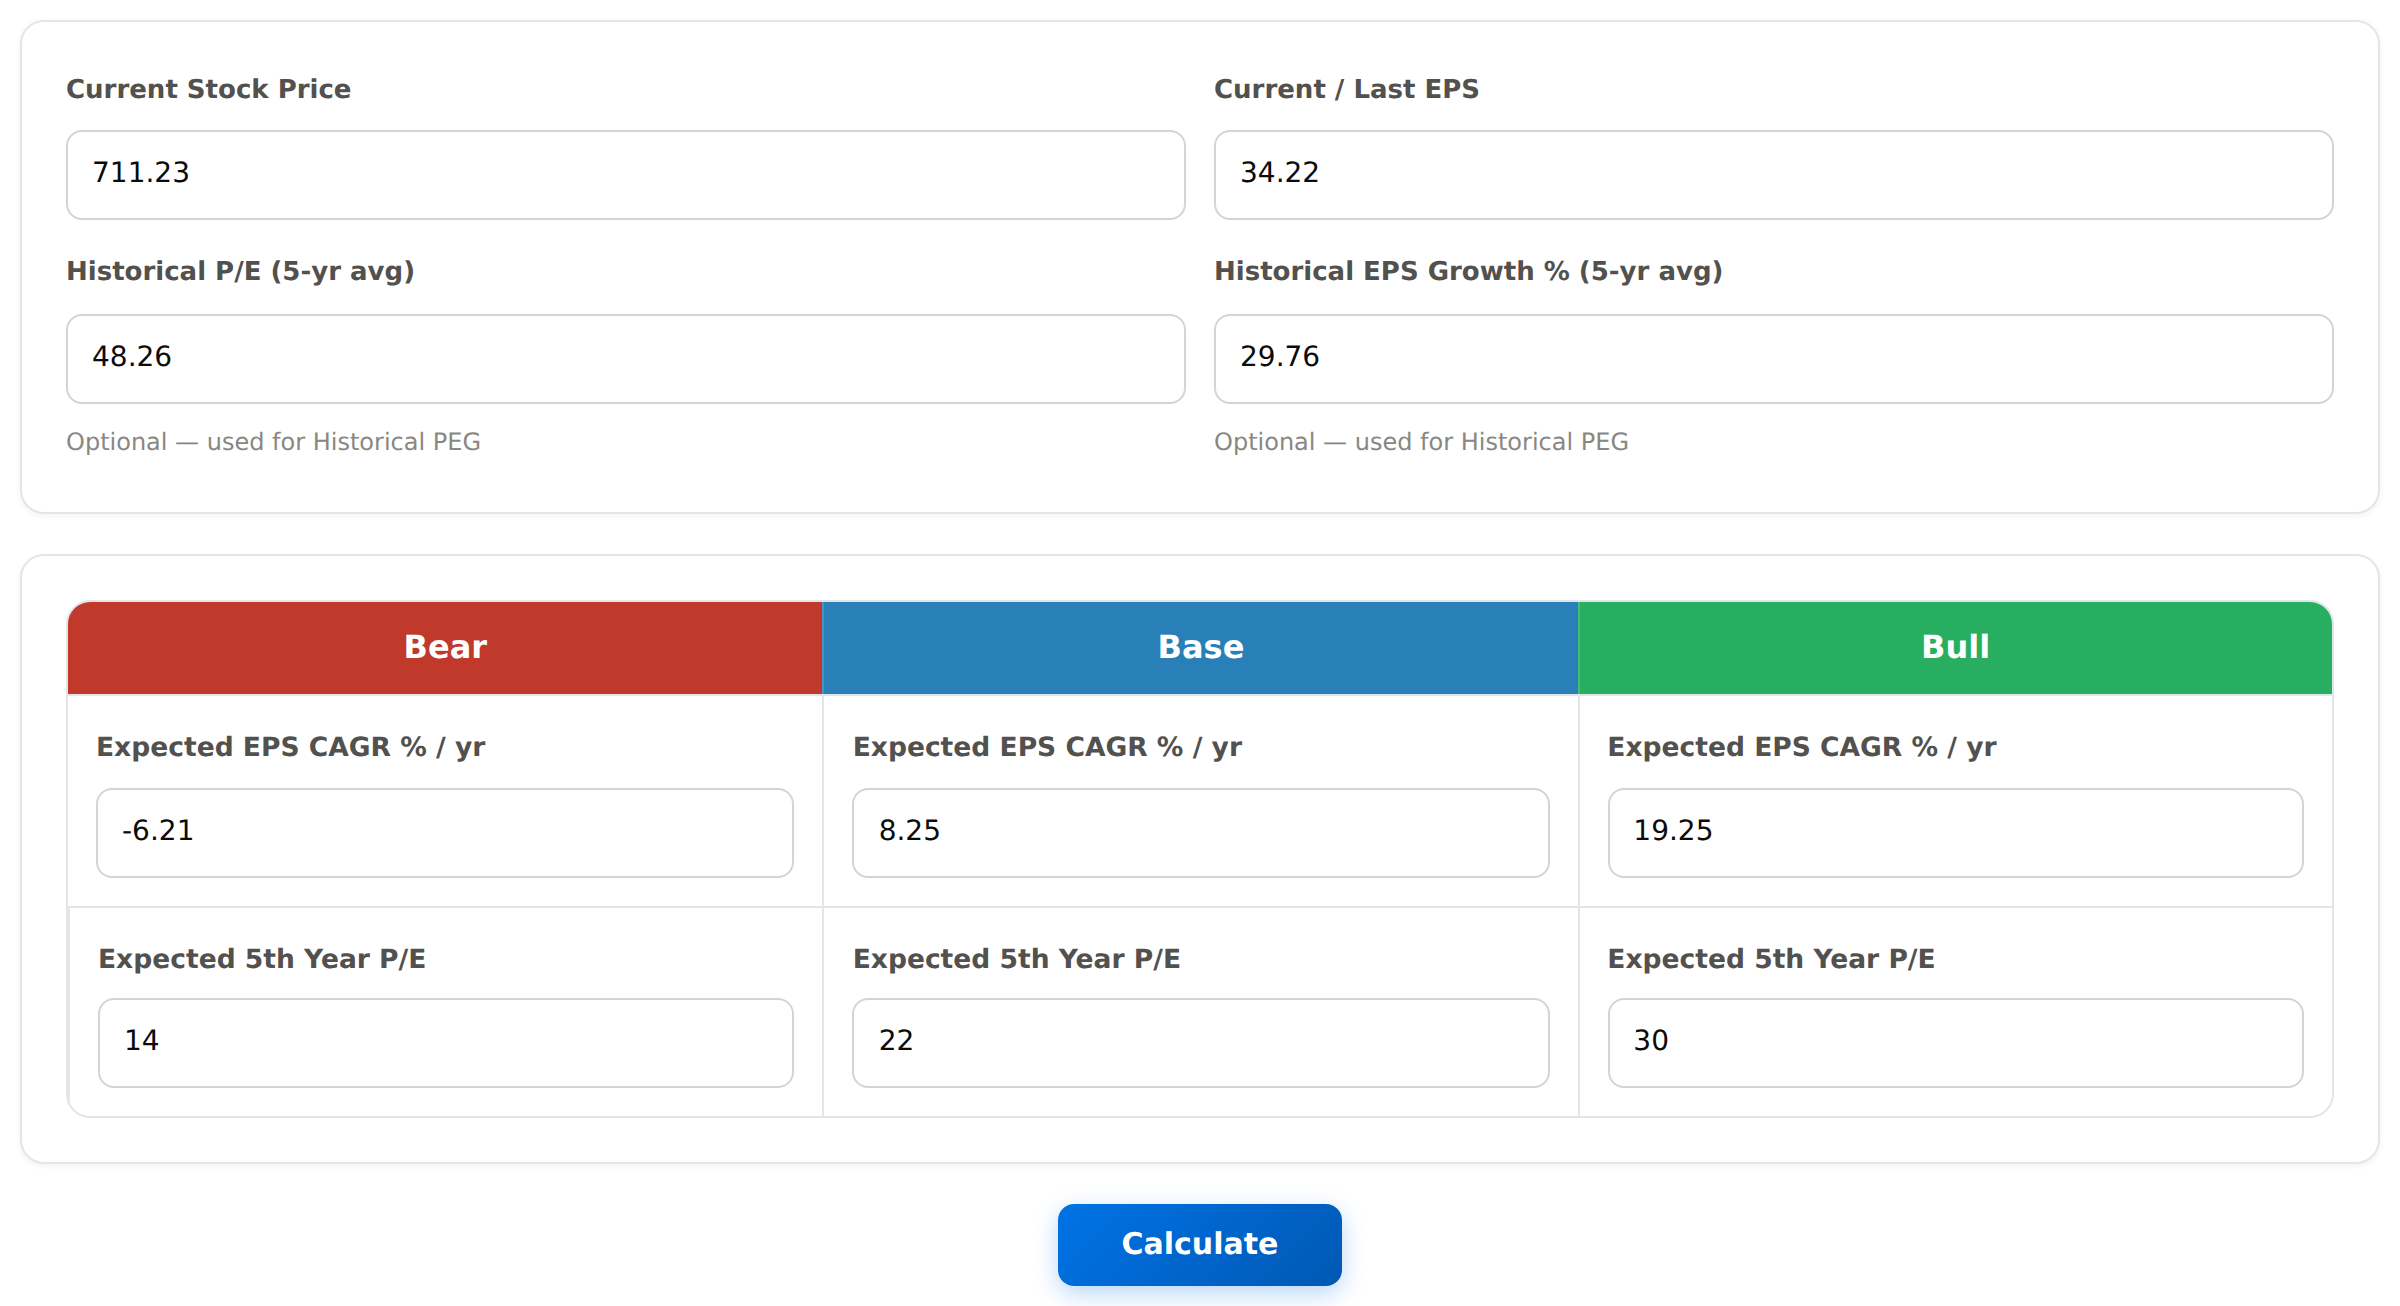
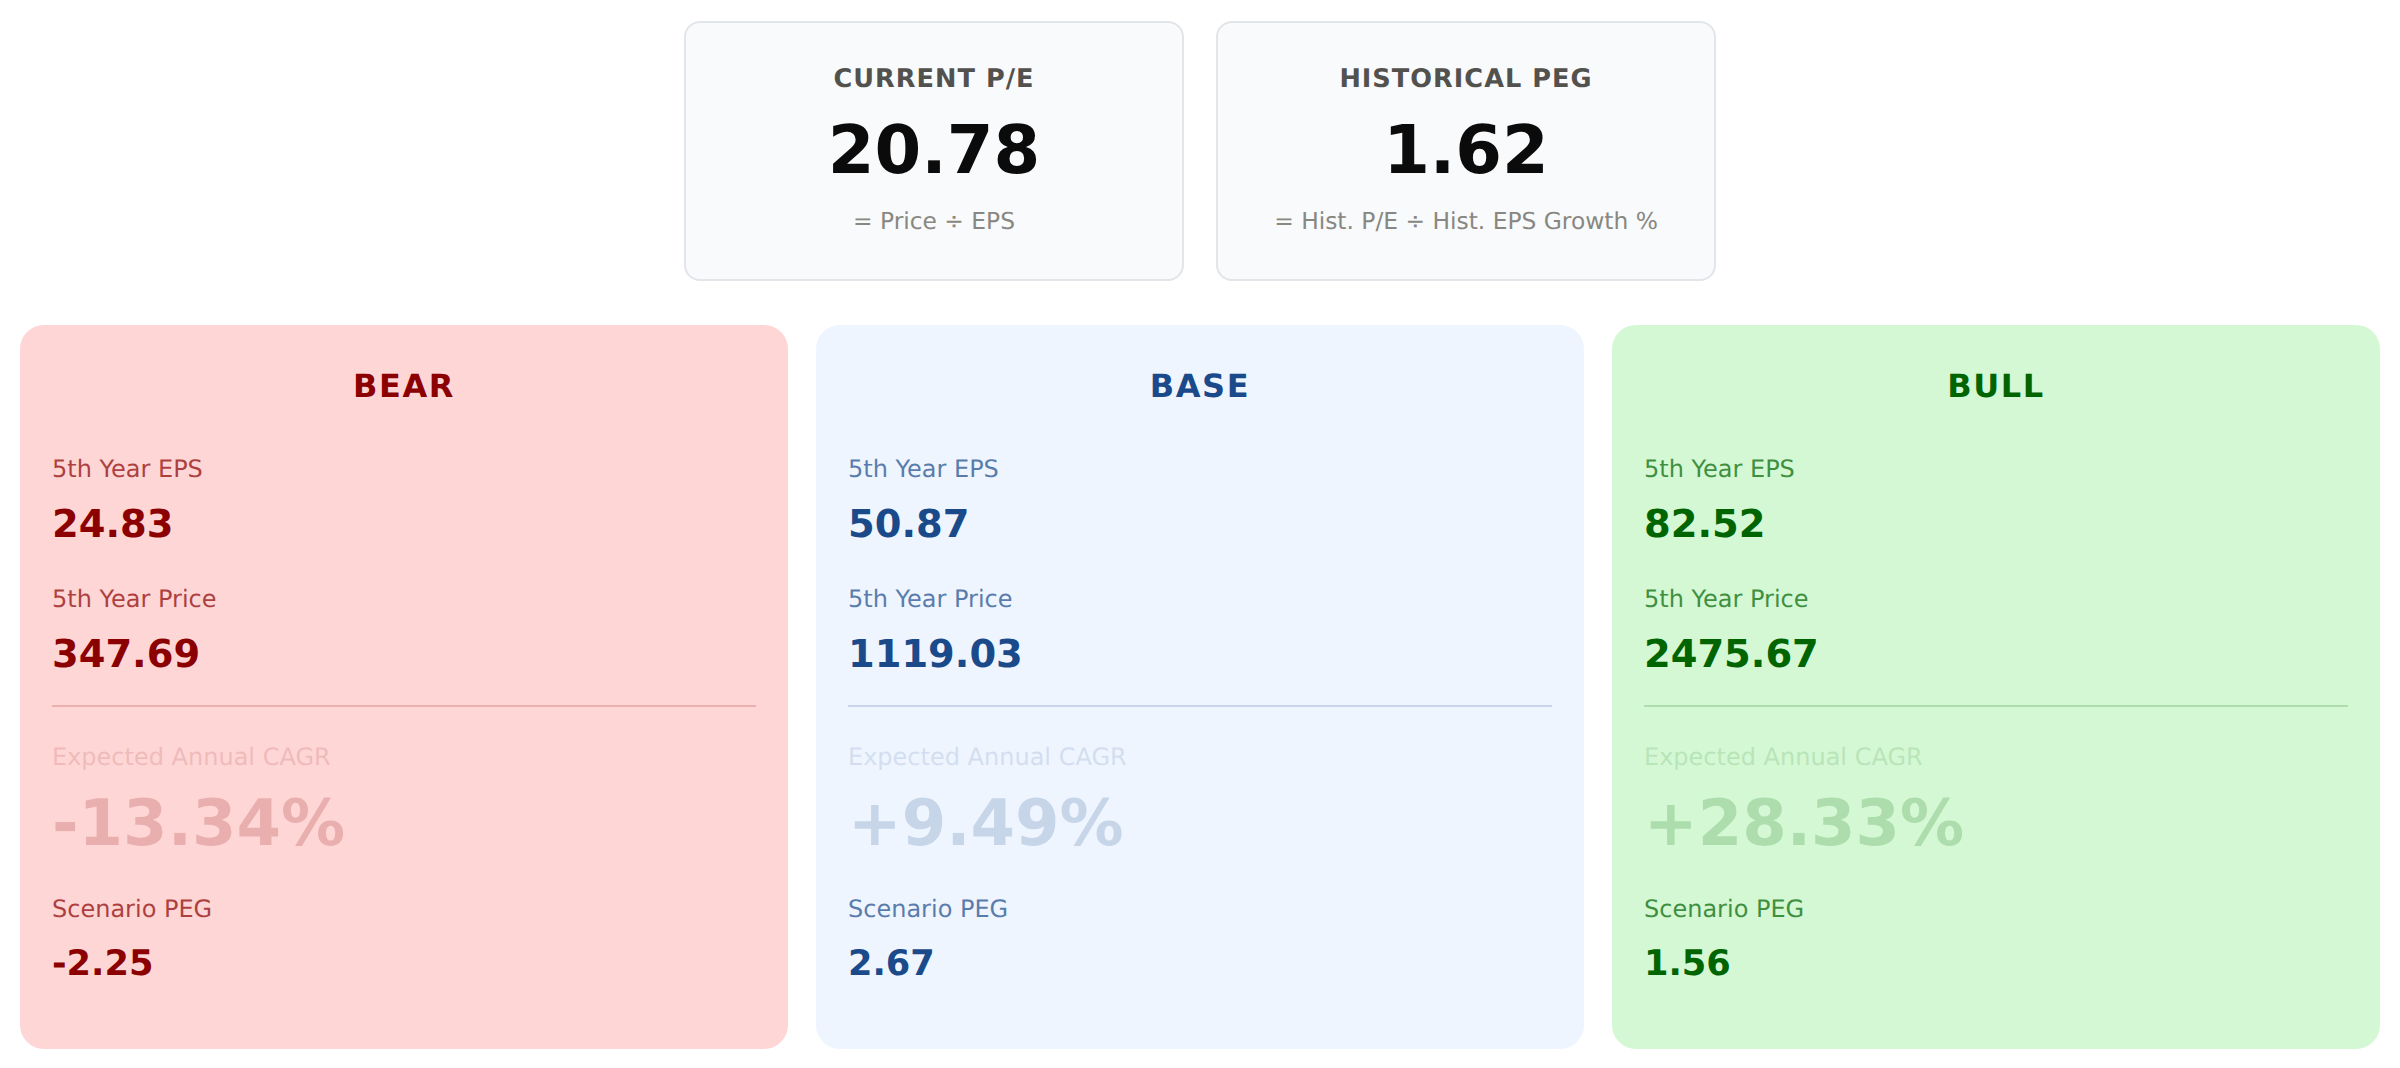
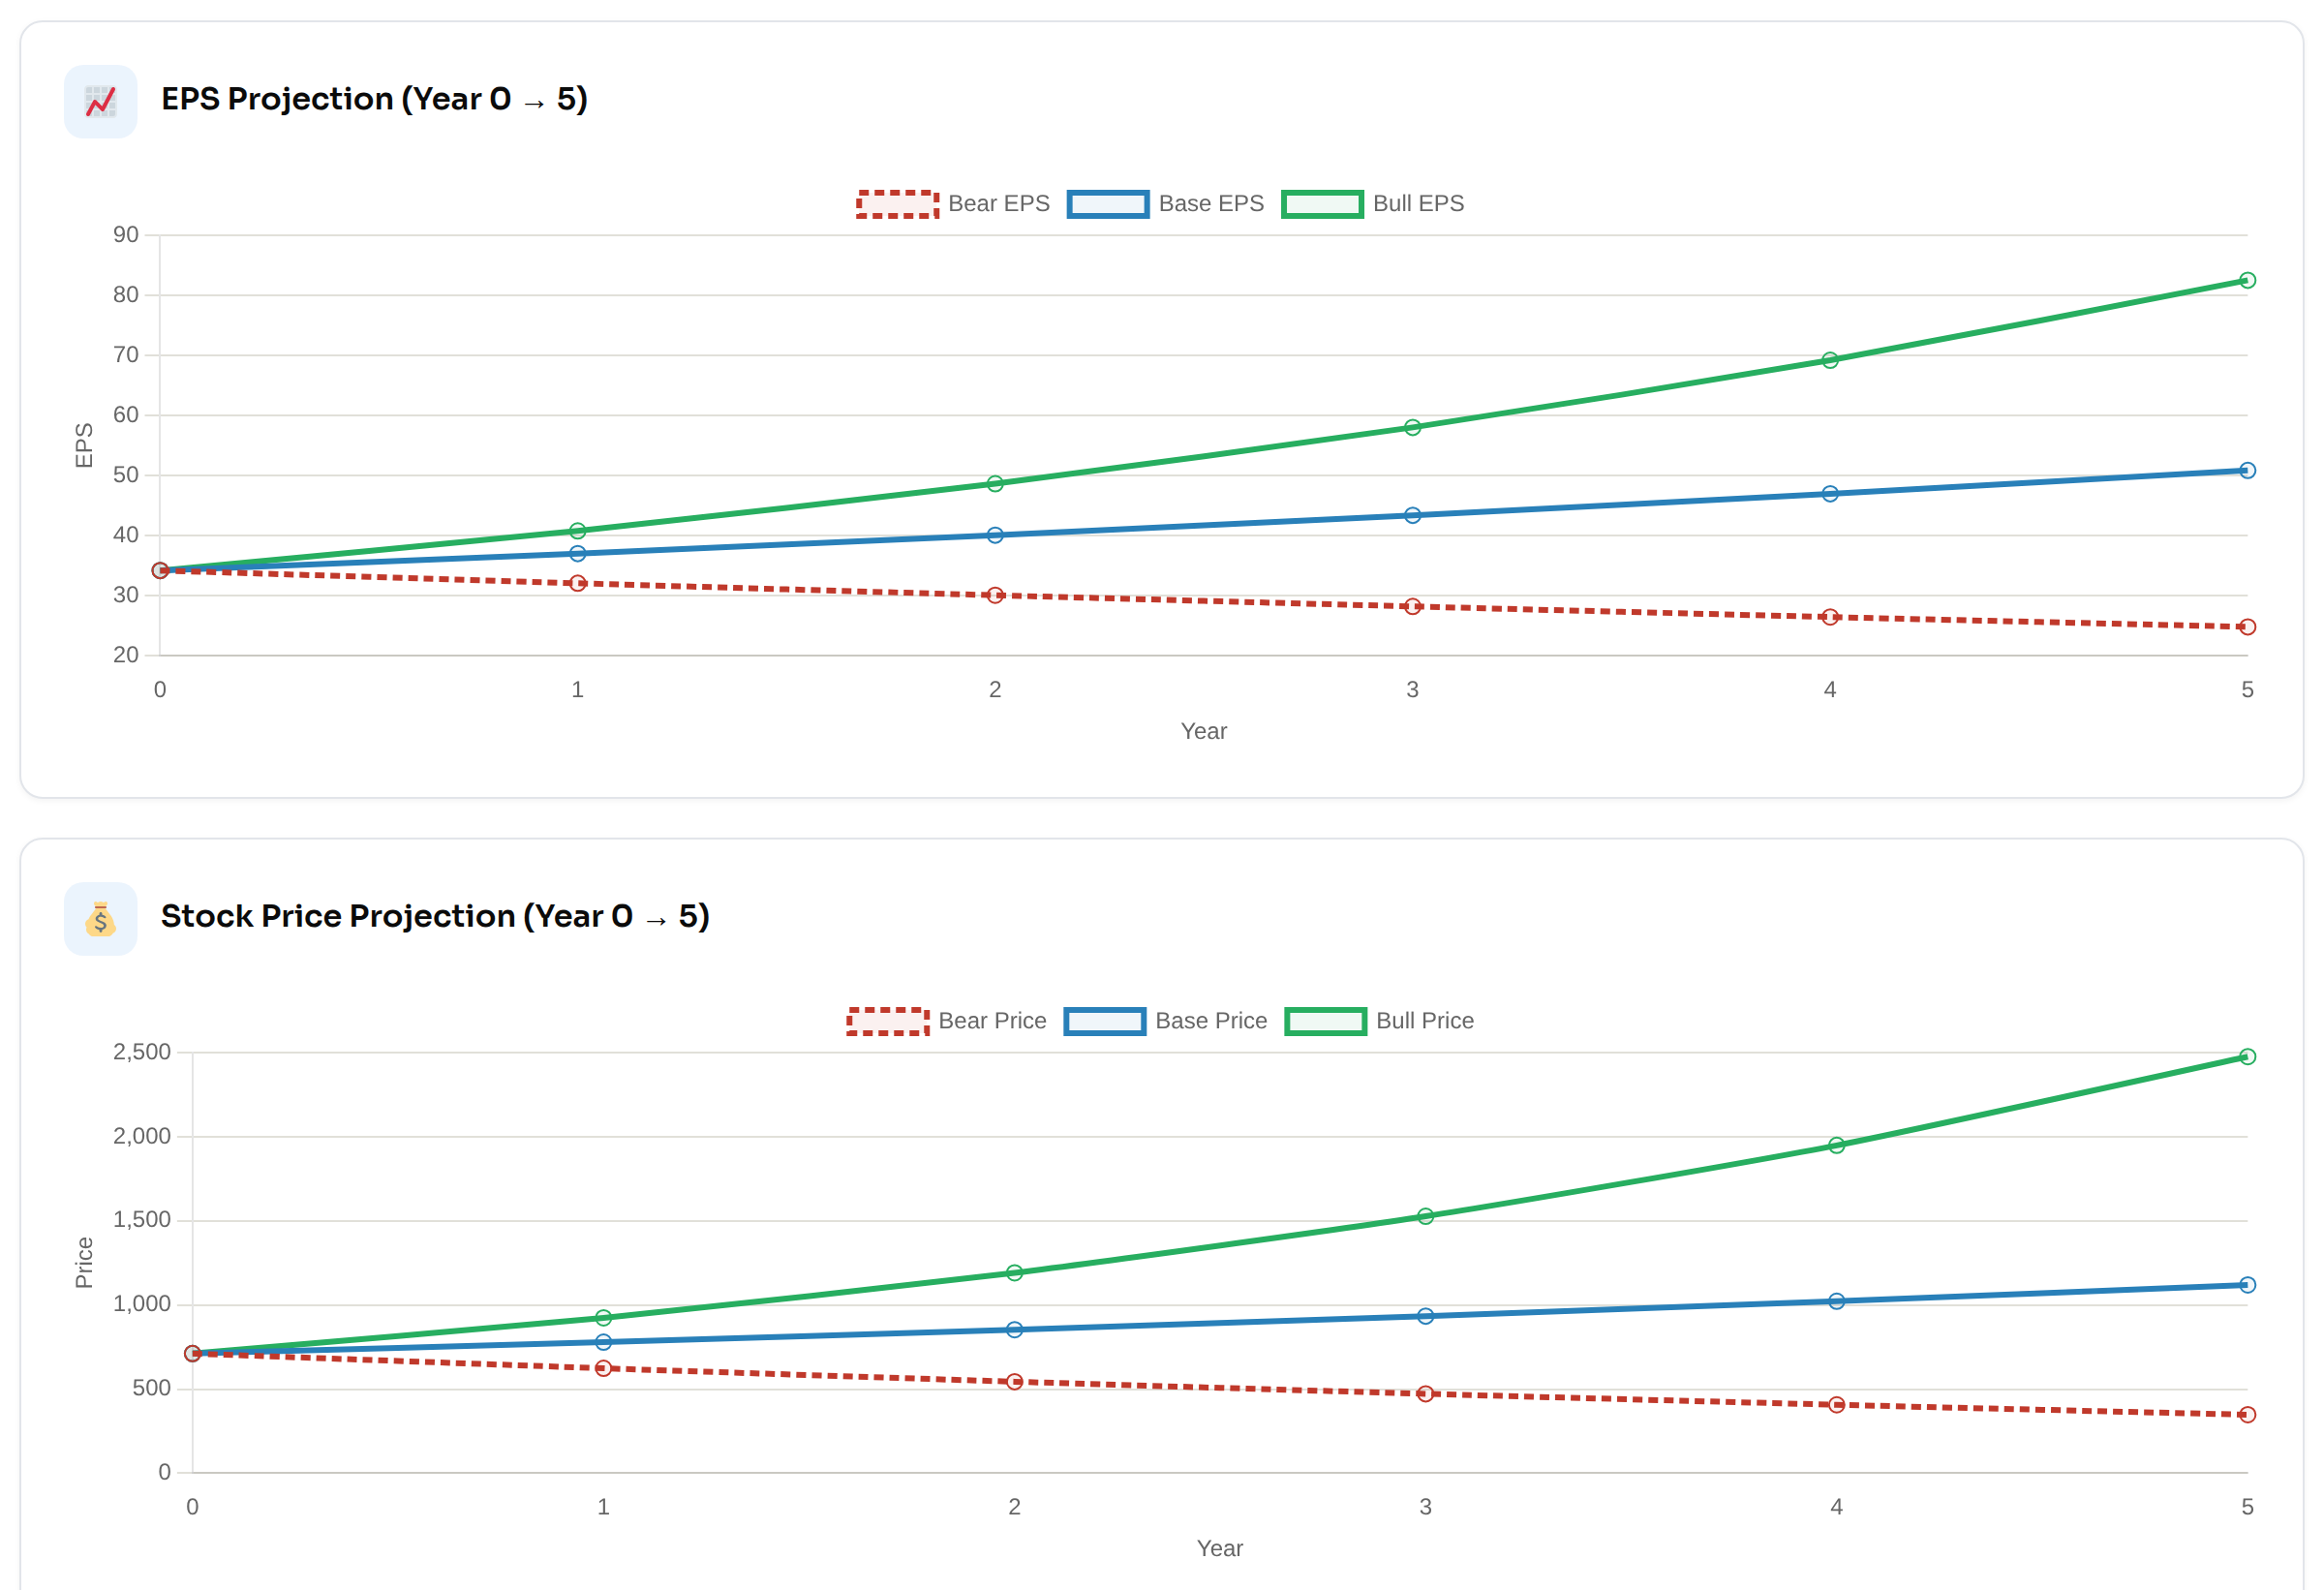
At today’s price, Base returns 9.49% a year, just below the 9.78% cost of capital. Bad loses 13.34% a year and Good earns 28.33%.
Try it yourself: EPS Scenario Returns — The Fair Value Journal
✍️Summary
Each method enters with its weight. Monte Carlo methods use their P10/P20 (buy) and P80/P90 (sell) values.
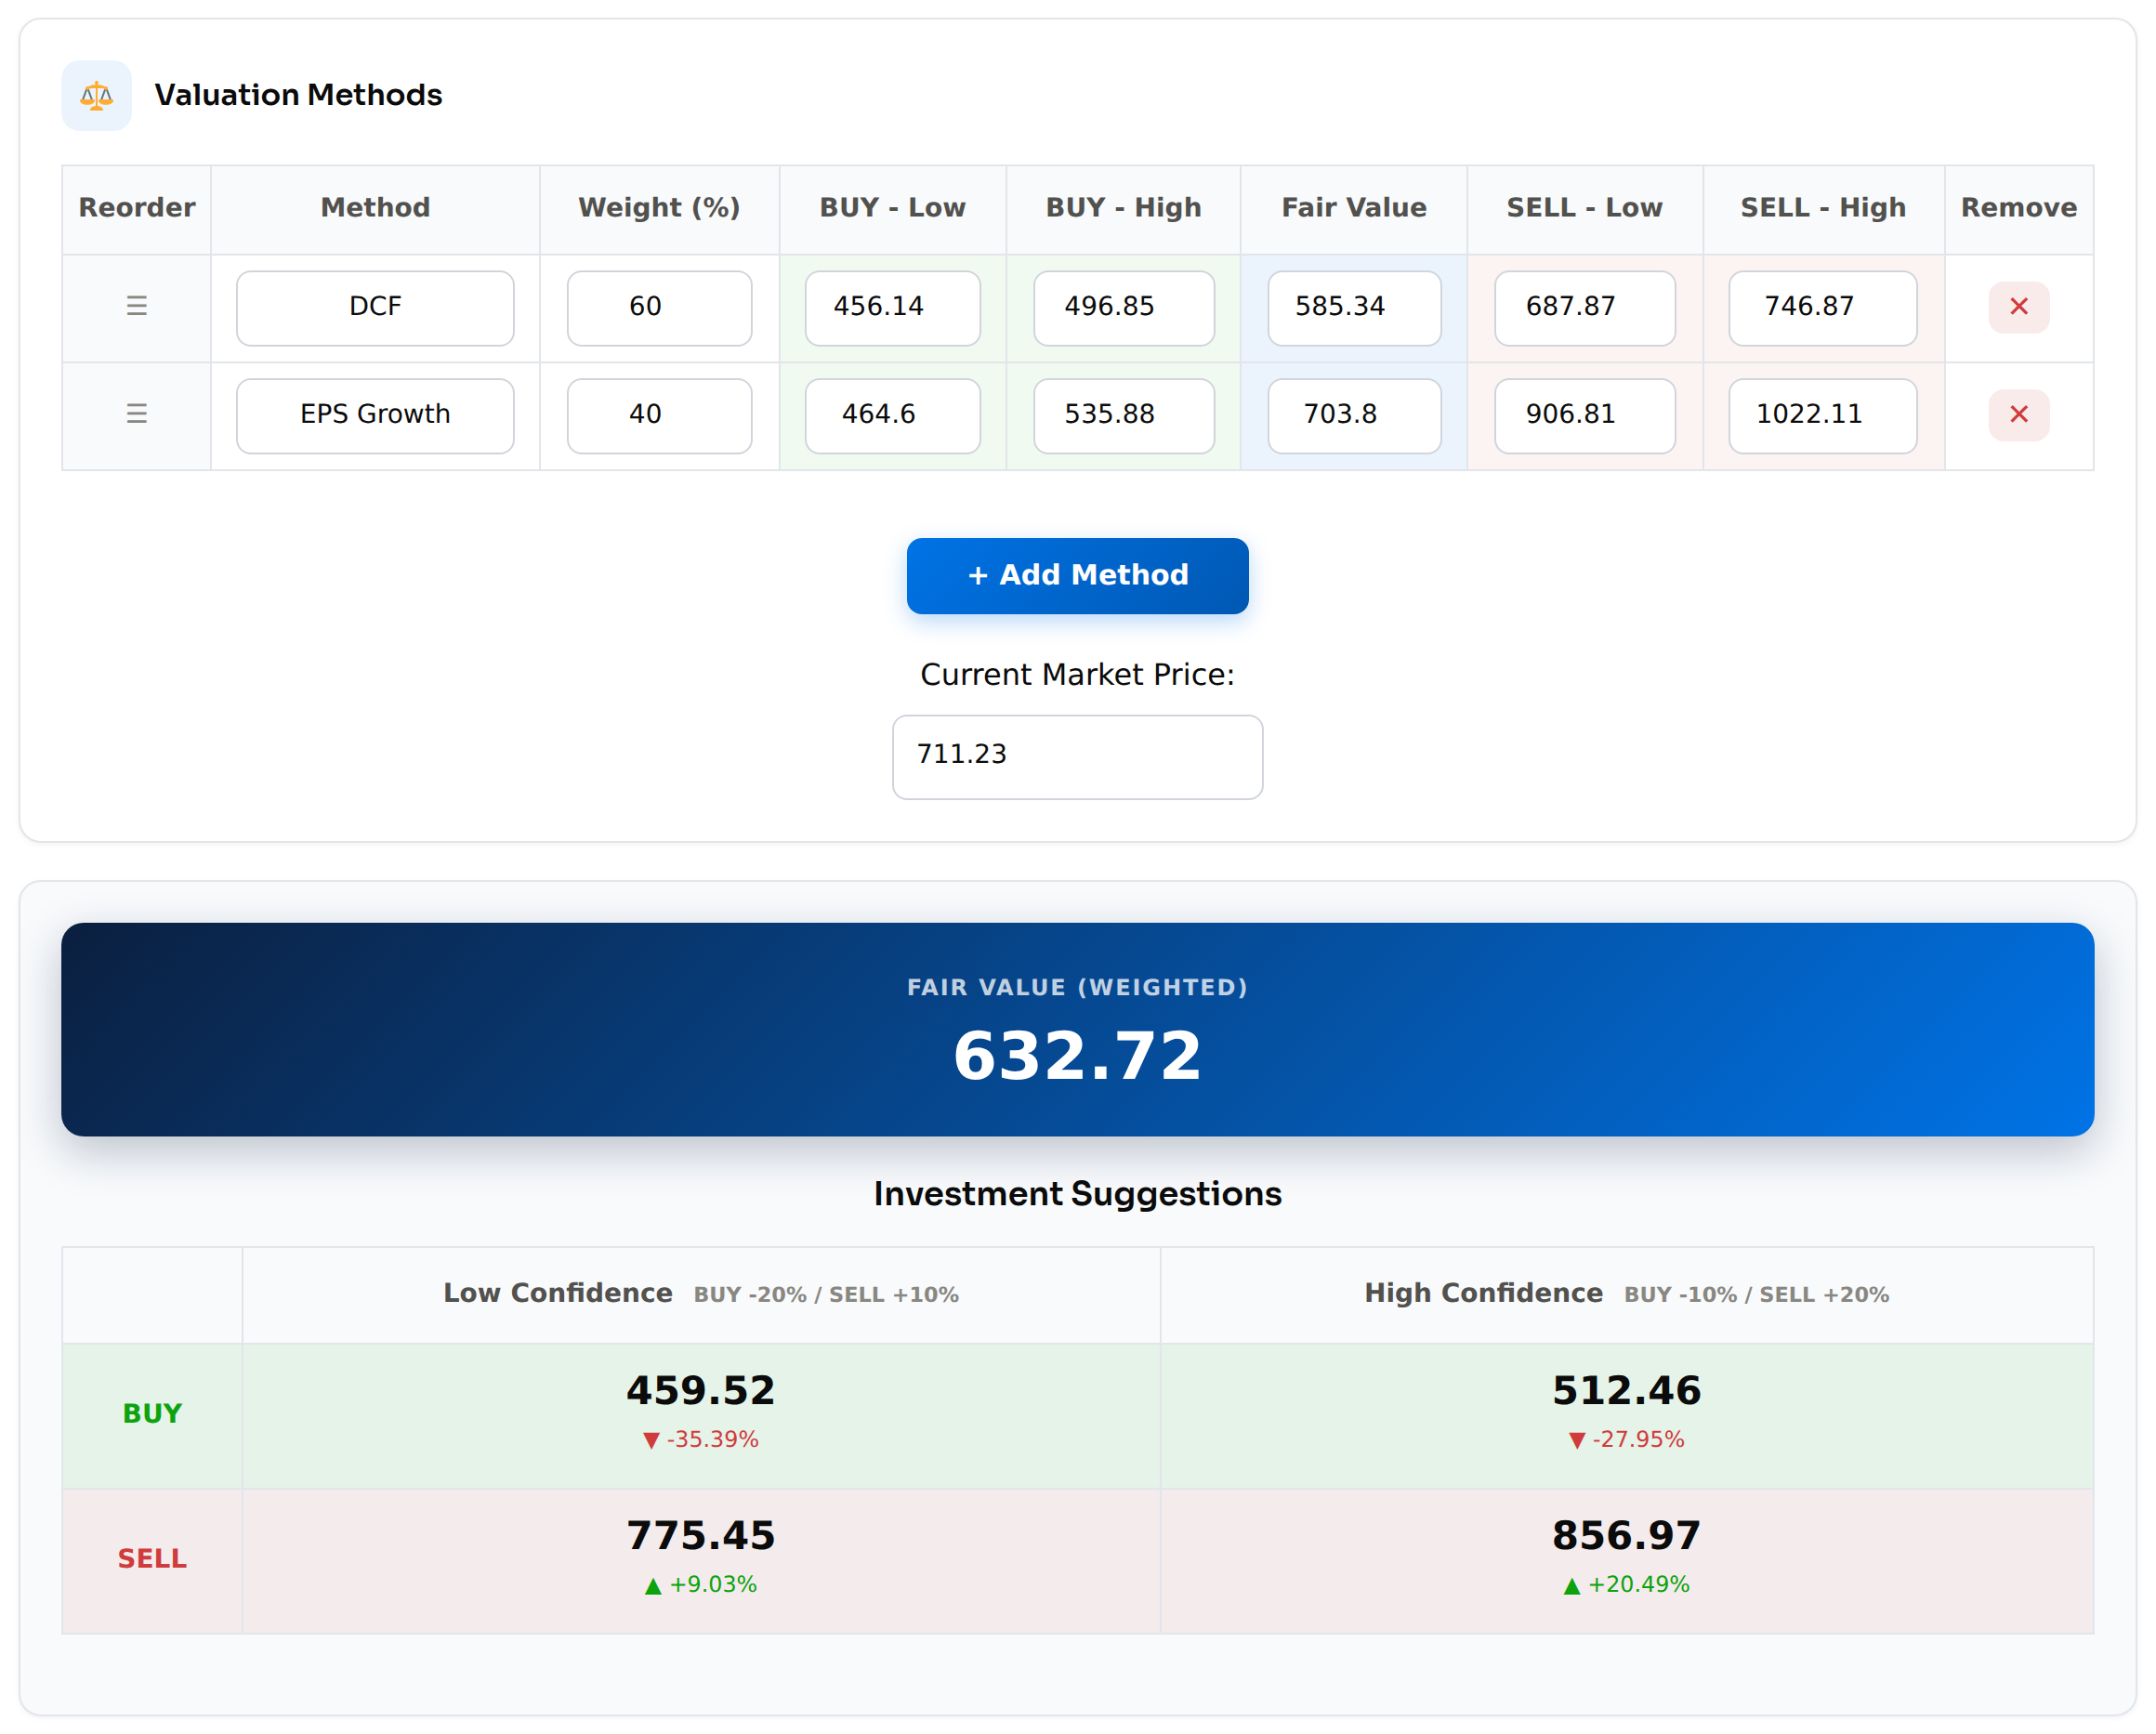
At $711.23, FICO still looks overvalued or slightly overvalued, even after its recent sudden price drop. I would probably buy or add below $512.46.
Fair Value: 632.72 dollars.