
🛒☁️ Business Overview
🎯Key Metrics
Total: 7/18
+1 ✅ Projected Operating Margin: 16.5%
+1 ✅ Projected 5-Year Revenue CAGR: 14.2%
+1 ✅ Last 5-Year ROIC: 13.44%
+1 ✅ Estimated Cost of Capital: 9.80% (lower than ROIC)
-1 ❌ Last 5-Year Shares Outstanding CAGR: +1.27%
+1 ✅ Projected 5-Year EPS CAGR: 15.02%
+0 ⚠️ Projected 5-Year Dividend CAGR: N/A
+1 ✅ Moody’s Rating: A1
+2 ✅ Morningstar Moat: Wide
+0 ⚠️ Morningstar Uncertainty: Medium
Amazon sells products online (its own and third-party sellers), runs ads and subscriptions, and rents cloud computing through AWS.
Two things matter now. First, GAAP net income is inflated: TTM net income is $134.8 billion, but about $69.8 billion (pre-tax) of non-operating income is mostly upward marks on its Anthropic stake (10-Q, Sep 2026). I strip that out and value the stakes separately. Second, capex is exploding: $175.7 billion in the first nine months of 2026 (10-Q), mostly AWS. That is why reinvestment, depreciation and the sales/capital ratio matter more than usual. Q4 guidance is sales of $240–247 billion (+12% to +16%) and operating income of $28.5–33.5 billion (Q3 2026 earnings release, 8-K).
I expect AWS and ads to keep lifting the margin, but heavy depreciation to hold back the pay-off.
These are my assumptions, and each one is explained below. Use the free tools linked in each section to make your own. This isn’t investment advice: take responsibility for your own decisions.
📖 My Narratives
Bad: AWS growth fades as AI capacity outruns demand, and depreciation from the capex wave squeezes margins while retail competition stays tough. Returns on the new capital stay low.
Base: AWS keeps growing fast on its backlog, advertising grows in the high teens, and retail grows ~9%. The margin keeps rising on mix, but depreciation absorbs part of the gain.
Good: AI demand fills the new capacity at good prices, so AWS meets management’s 40%+ growth outlook and keeps its margin near today’s level. Ads and logistics efficiency lift retail margins, and returns on the new capital rise.
| Bad | Base | Good |
|---|---|---|---|
Revenue growth (Year 1 / Years 2-5) | 11% / 9% | 15% / 14% | 18% / 17% |
Operating margin (initial → terminal) | 12% → 12.5% | 13% → 16.5% | 14% → 20% |
Sales / Capital (initial → terminal) | 0.6 → 1.1 | 0.8 → 1.6 | 1.0 → 2.2 |
Terminal ROIC | 10% | 14% | 18% |
Terminal cost of capital | 9.80% | 9.5% | 8.54% |
Net margin (Year 5) / Shares CAGR / P/E (Year 5) | 9.5% / +1.8% / 21 | 11.3% / +1.4% / 27 | 13.0% / +1.0% / 32 |
Methods: DCF 60%, EPS Growth 40%, because Amazon reinvests nearly all its cash and pays no dividend, and its multiples have changed regime (retail only, then AWS and ads, now an AI capex cycle), so I use no historical multiples.
The Base narrative drives each valuation. Bad and Good set the low and high end of each Monte Carlo range.
📈Business Valuation
Revenue Growth
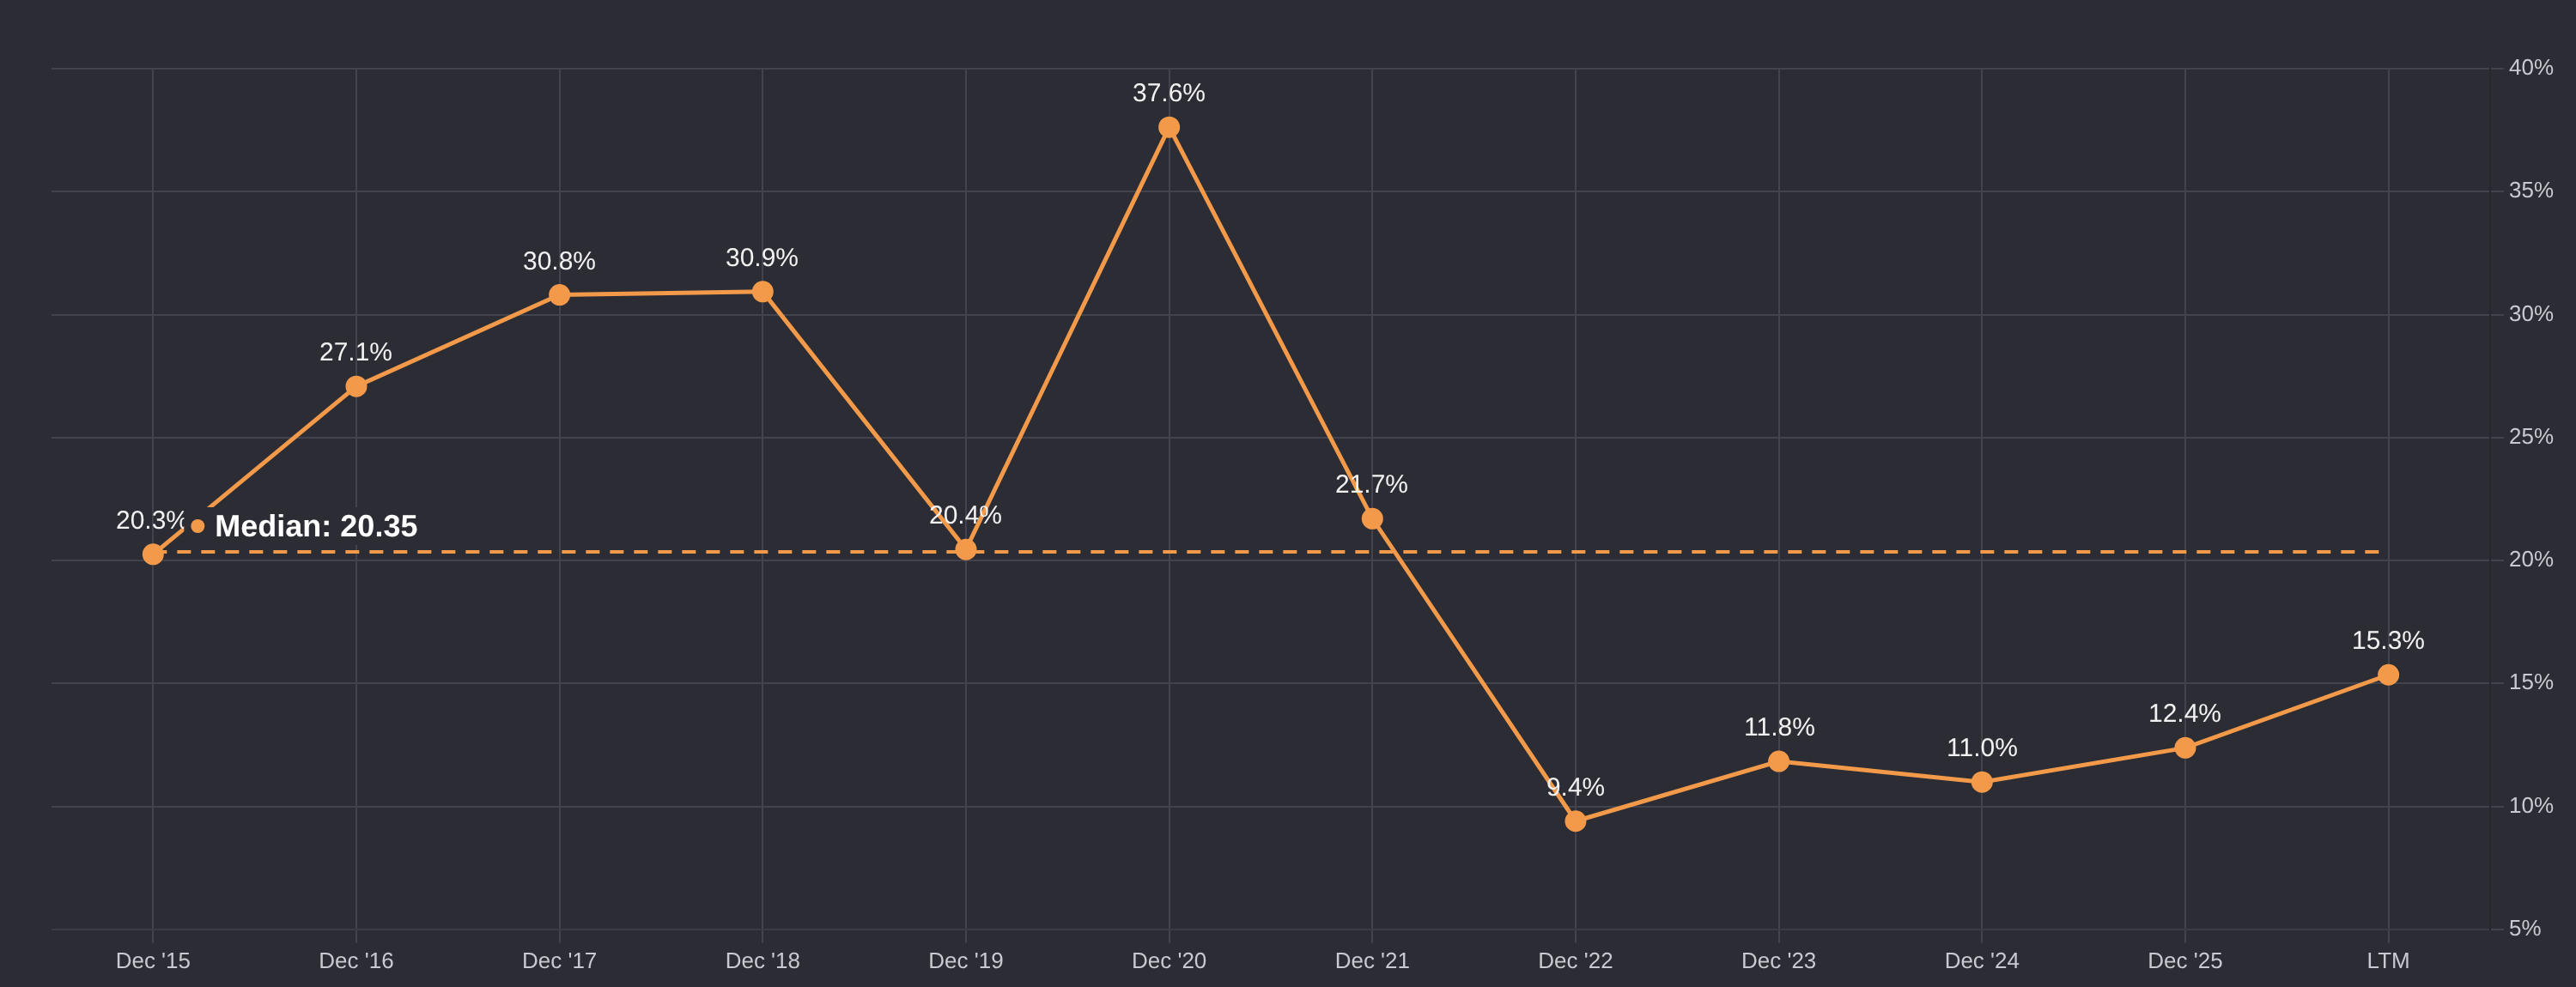
Median growth is ~20% over 2015–LTM, but it has been 9–15% since 2022. TTM revenue growth is 15.35%, and Q4 guidance is +12% to +16%.
💡 Year 1: 15% (Bad 11% · Good 18%). Years 2-5: 14% (Bad 9% · Good 17%). Year 1 sits near the top of the Q4 guidance range, because AWS grew 39% in Q3 and ads are guided to grow in the high teens.
For years 2-5, management says AWS growth will be “over 40% both in 2027 and in 2028”. With AWS at ~23% of sales growing 40% and the rest growing ~9%, total growth would be ~16%. The ~9% for the rest is the midpoint of what the Q4 guidance implies for retail if AWS grows ~40%. Base stays two points below that: the new capacity has to be built and filled first, and a larger base is harder to grow. Good is the case where the outlook is met. Bad is AWS fading to ~15%.
Cost of Capital
Inputs: the latest 10-Q (Sep 2026), the 10-year US bond (5.05%) as the risk-free rate, and revenue by industry and geography. Debt rating: Moody’s A1. Total debt is $296.1 billion: long-term debt $180.9 billion, short-term $0.4 billion, finance leases $14.5 billion and operating leases $100.3 billion (balance sheet, Sep 2026). Interest expense is $4.5 billion (TTM). The tax rate is 22.5%: the TTM effective rate with the Anthropic gain and its one-off $15.2 billion tax both removed is (38,885 − 15,200) / (174,165 − 69,799) = 22.7%, and Q3 2026 alone was 23% (10-Q). Industry split from the TTM revenue by product line: AWS ($161.4 billion) as Software, advertising ($78.0 billion) as Advertising, and the rest as Retail (General). Geography uses the FY2025 country mix from the 10-K (the 10-Q has no country table), scaled to TTM revenue; “rest of world” is entered as Global.
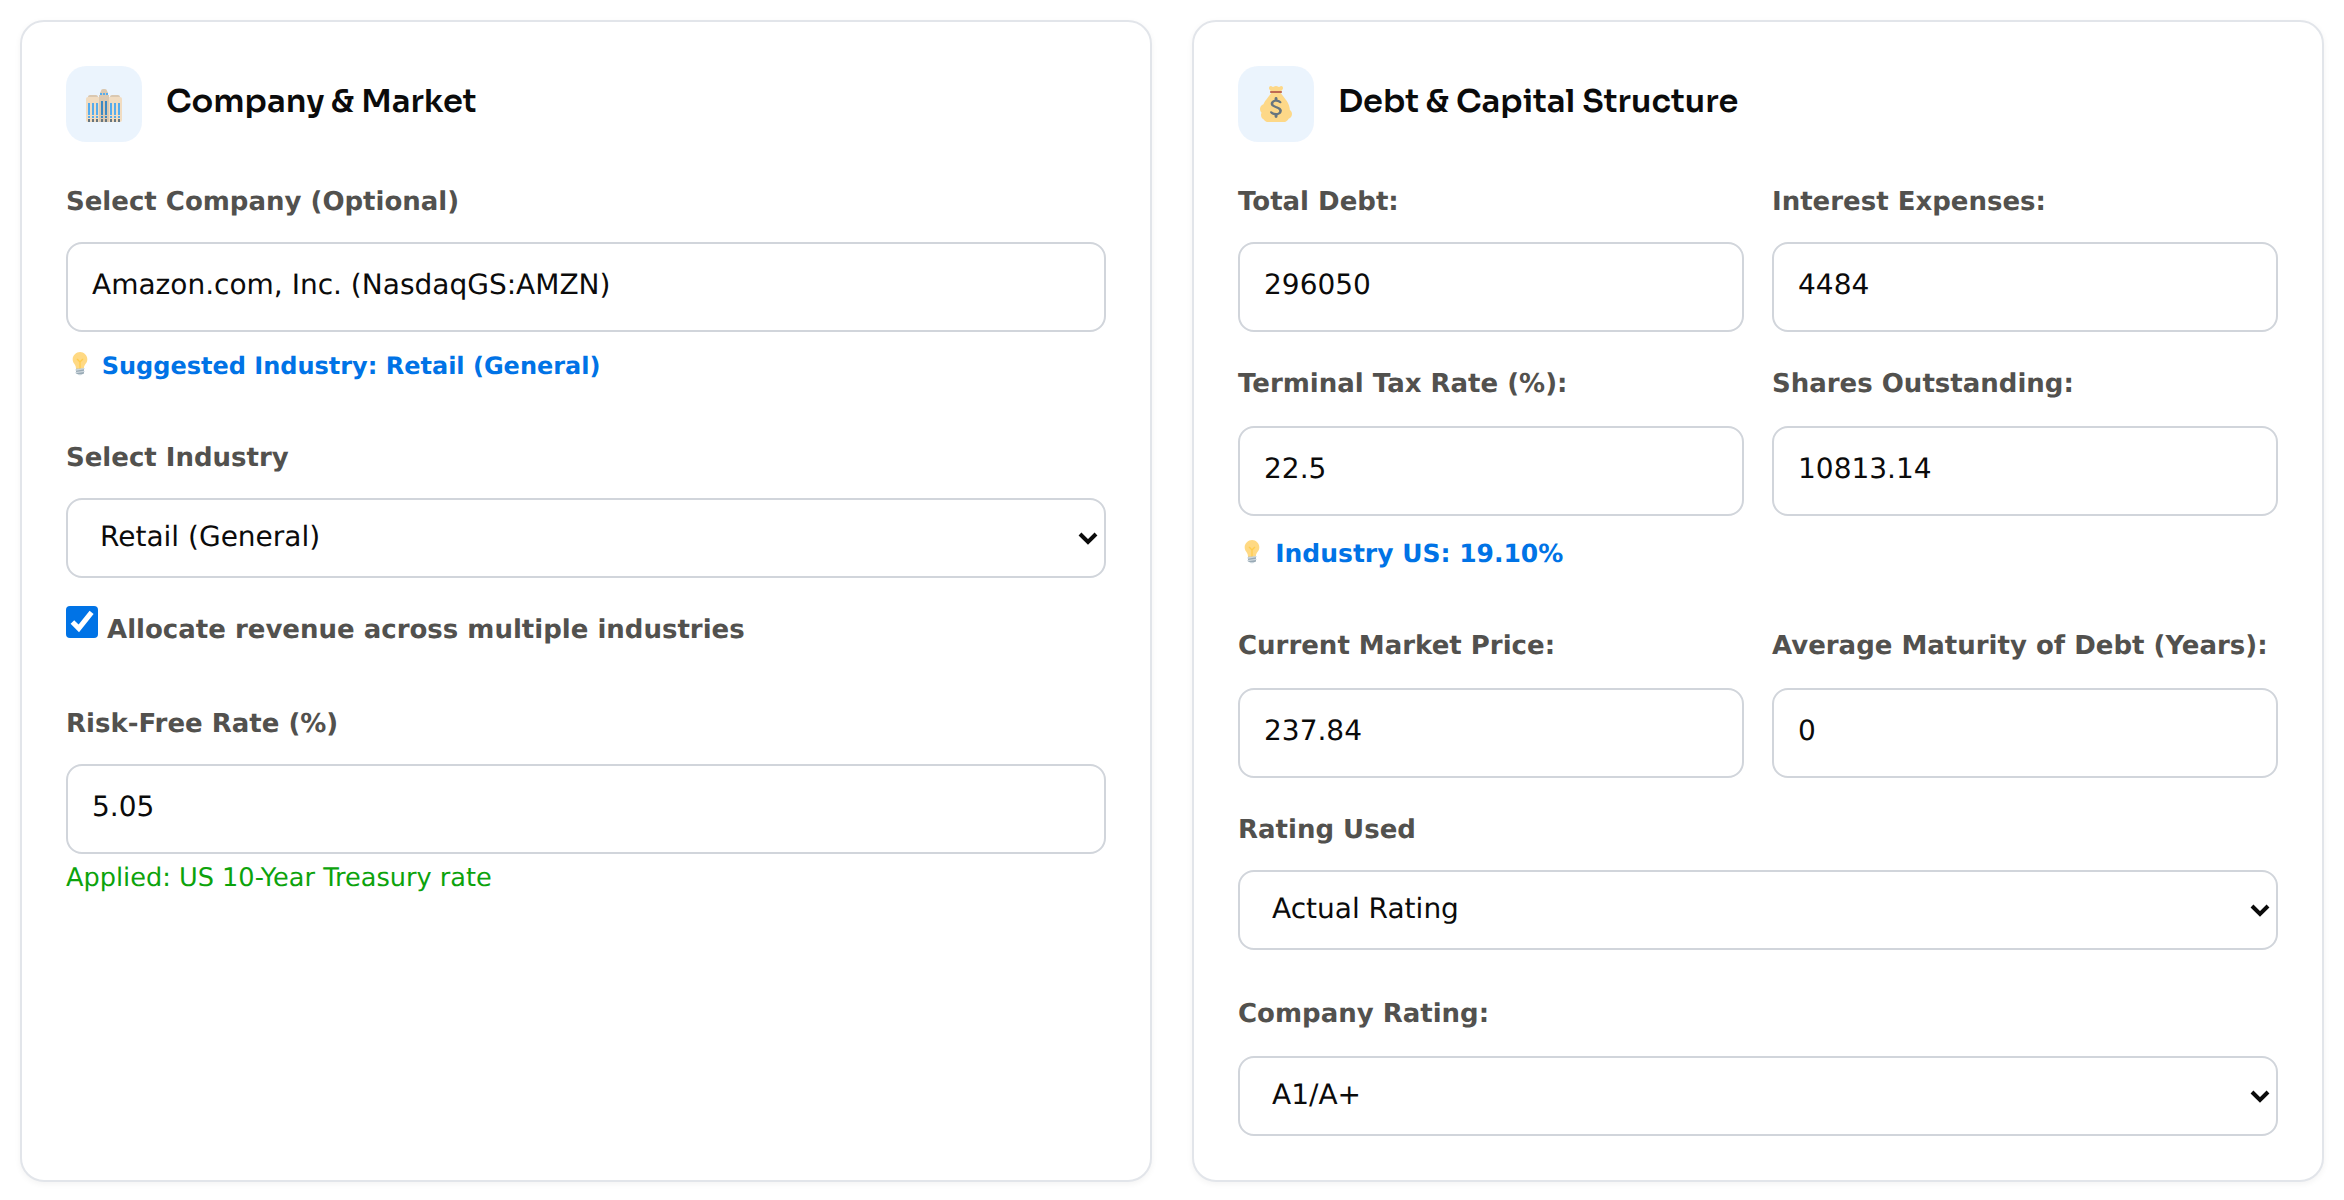
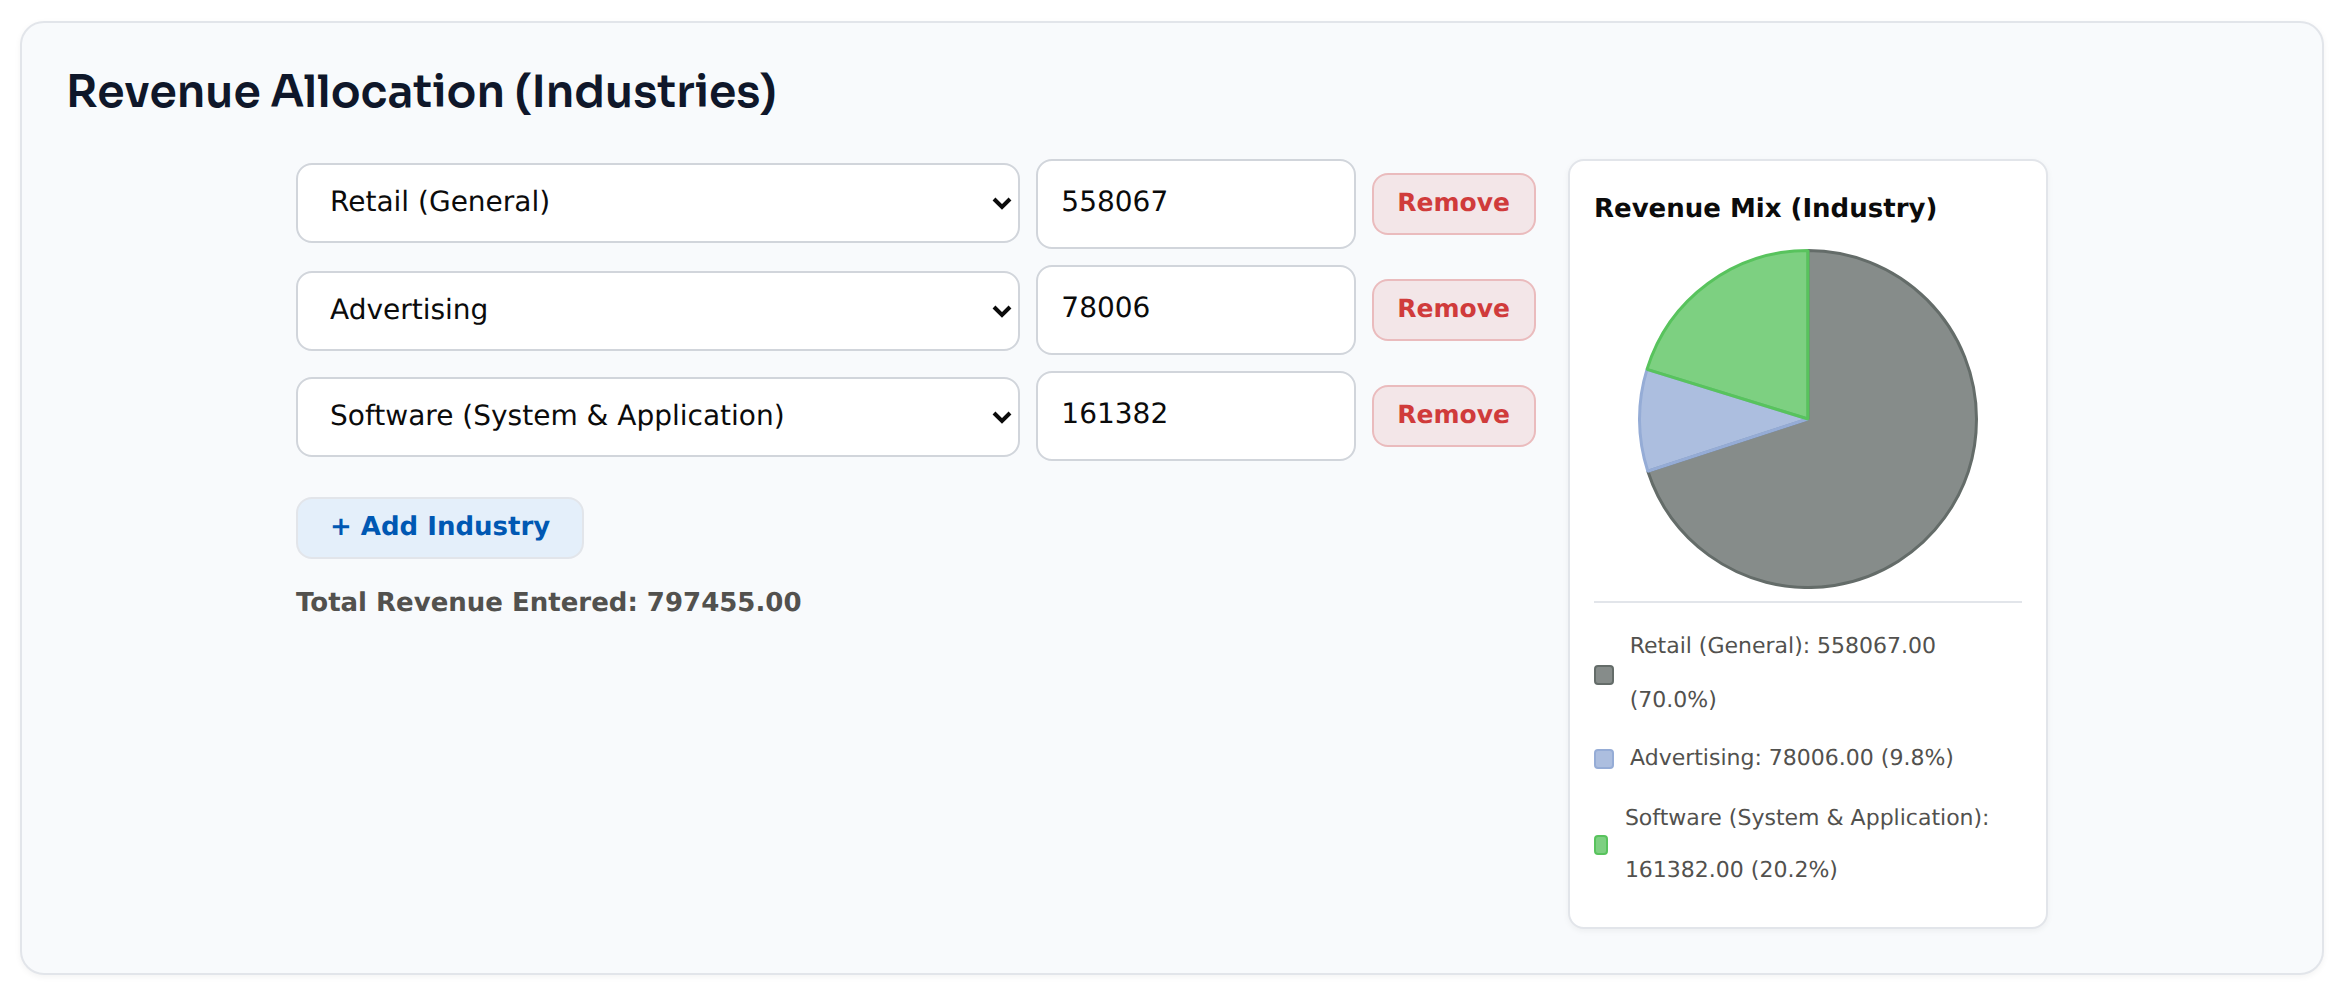
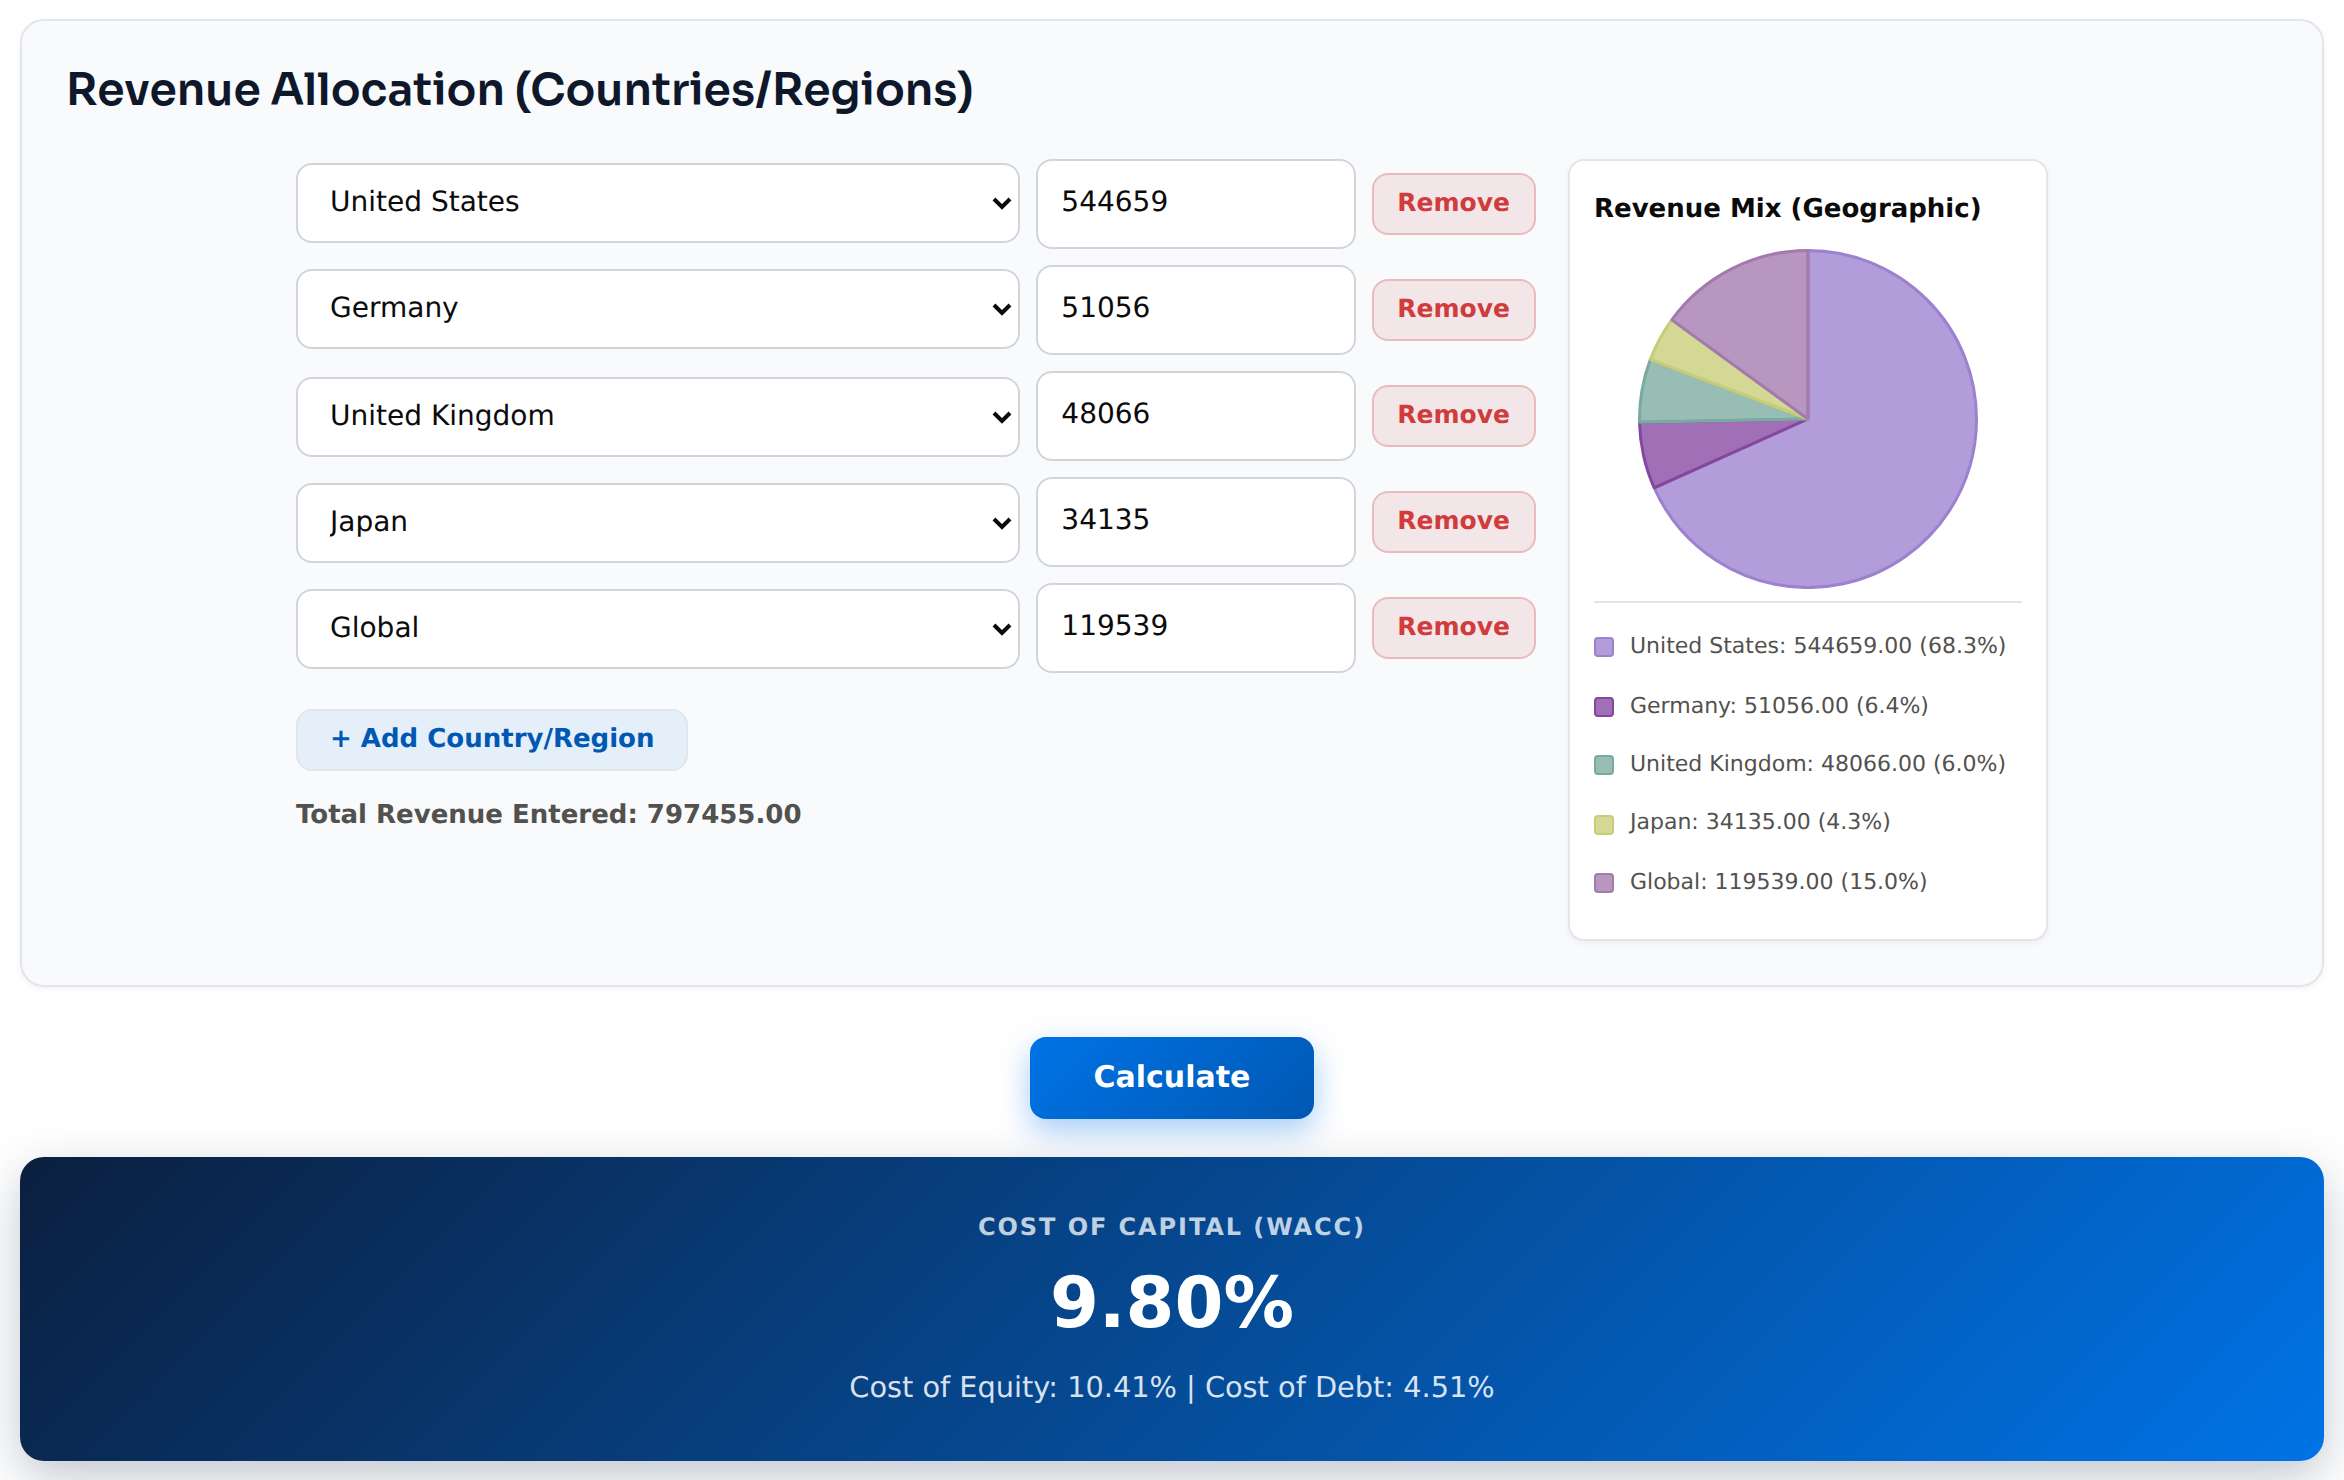
Cost of Capital: 9.80%. The industry average in the US is ~7.27% for Retail (General) (70% of revenue), ~7.81% for Advertising (9.8%) and ~9.34% for Software (System & Application) (20.2%). Blending them with the weights the tool uses for beta (revenue × EV/Sales) gives ~8.5%, which I use as the lower bound for the terminal cost of capital and the EPS Monte Carlo.
💡 It starts at 9.80% and converges to 9.5% (Bad 9.80% · Good 8.54%). The starting point comes from the 5.05% risk-free rate and the tool’s beta and equity risk premium. I keep those inputs unchanged, so the drift is only a view: AWS contracts and ads are steadier than retail, and the debt weight is small. Base ends one point above the ~8.5% blended industry floor. Bad stays at 9.80%. Good ends at the floor (8.54%, 0.04 points above the ~8.5% blend), and the same figure is the lower bound of the EPS Monte Carlo cost of capital.
Try it yourself: Cost of Capital – The Fair Value Journal (free).
Operating Margin
Amazon reports three segments (North America, International, AWS), and each carries operating income. They mix two axes: North America and International are retail by region, while AWS is a business line. I show each on its true axis. Country sales are in the 10-K only, so they stop at FY2025. The business-line mix goes to LTM.
Geographic Segments
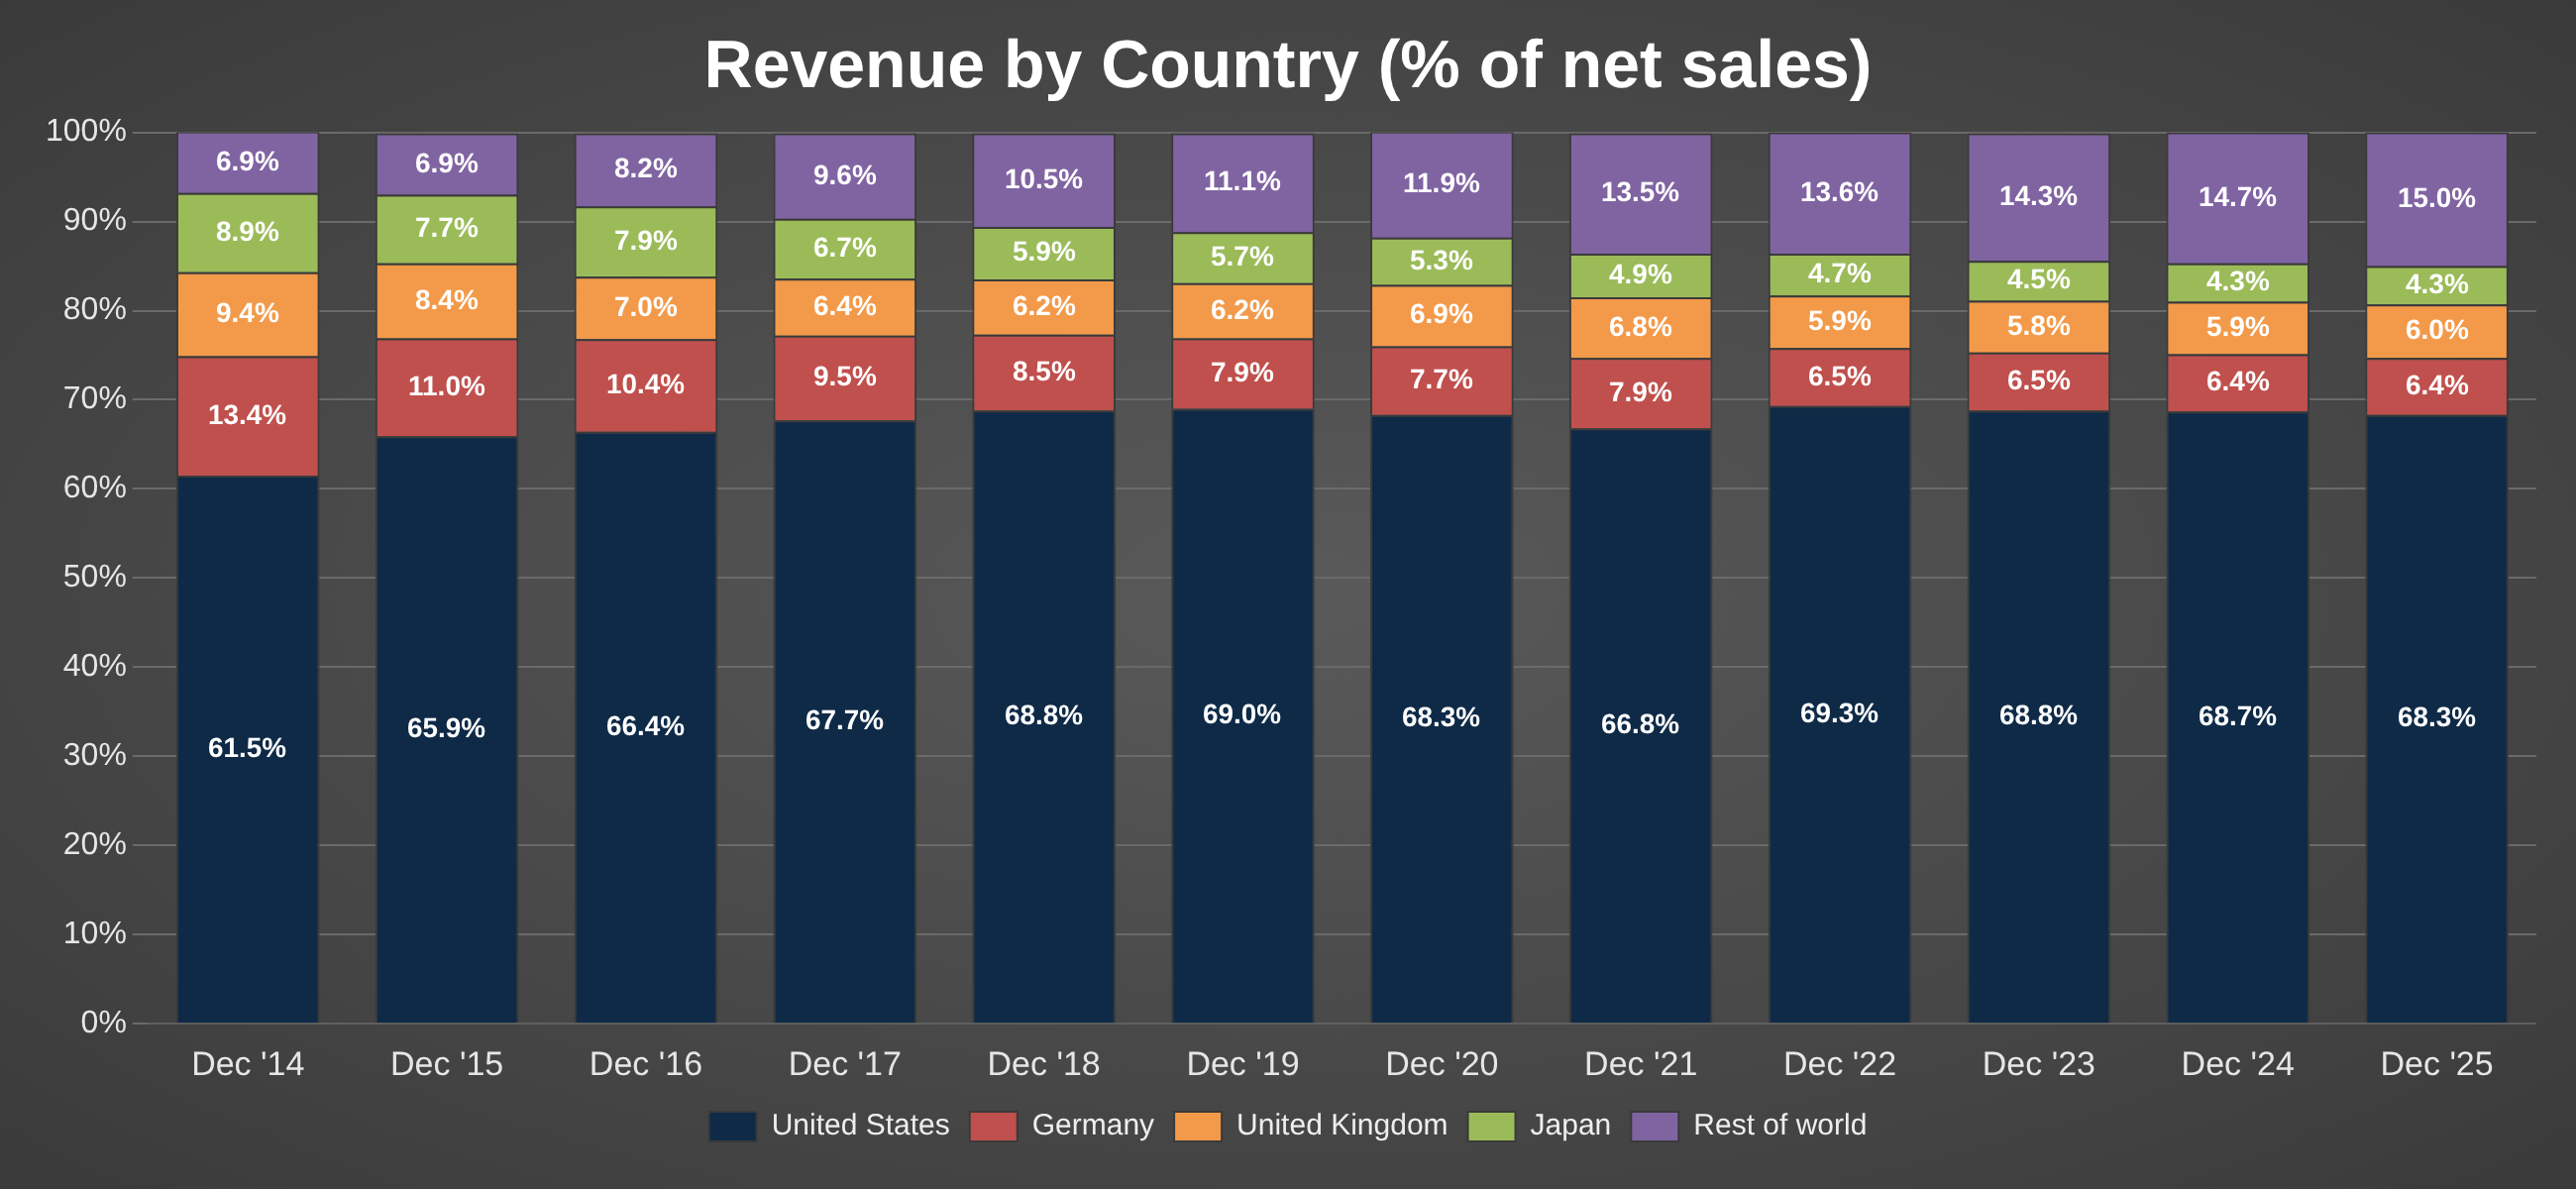
United States: 68.3% of revenue (FY2025): Amazon’s biggest market. Germany 6.4%, United Kingdom 6.0%, Japan 4.3%, rest of world 15.0%: the international markets, which have grown faster than the US since 2023. The US share has stayed at ~67–69% since 2017. Operating margin by country isn’t reported. The retail segments are the closest proxy:
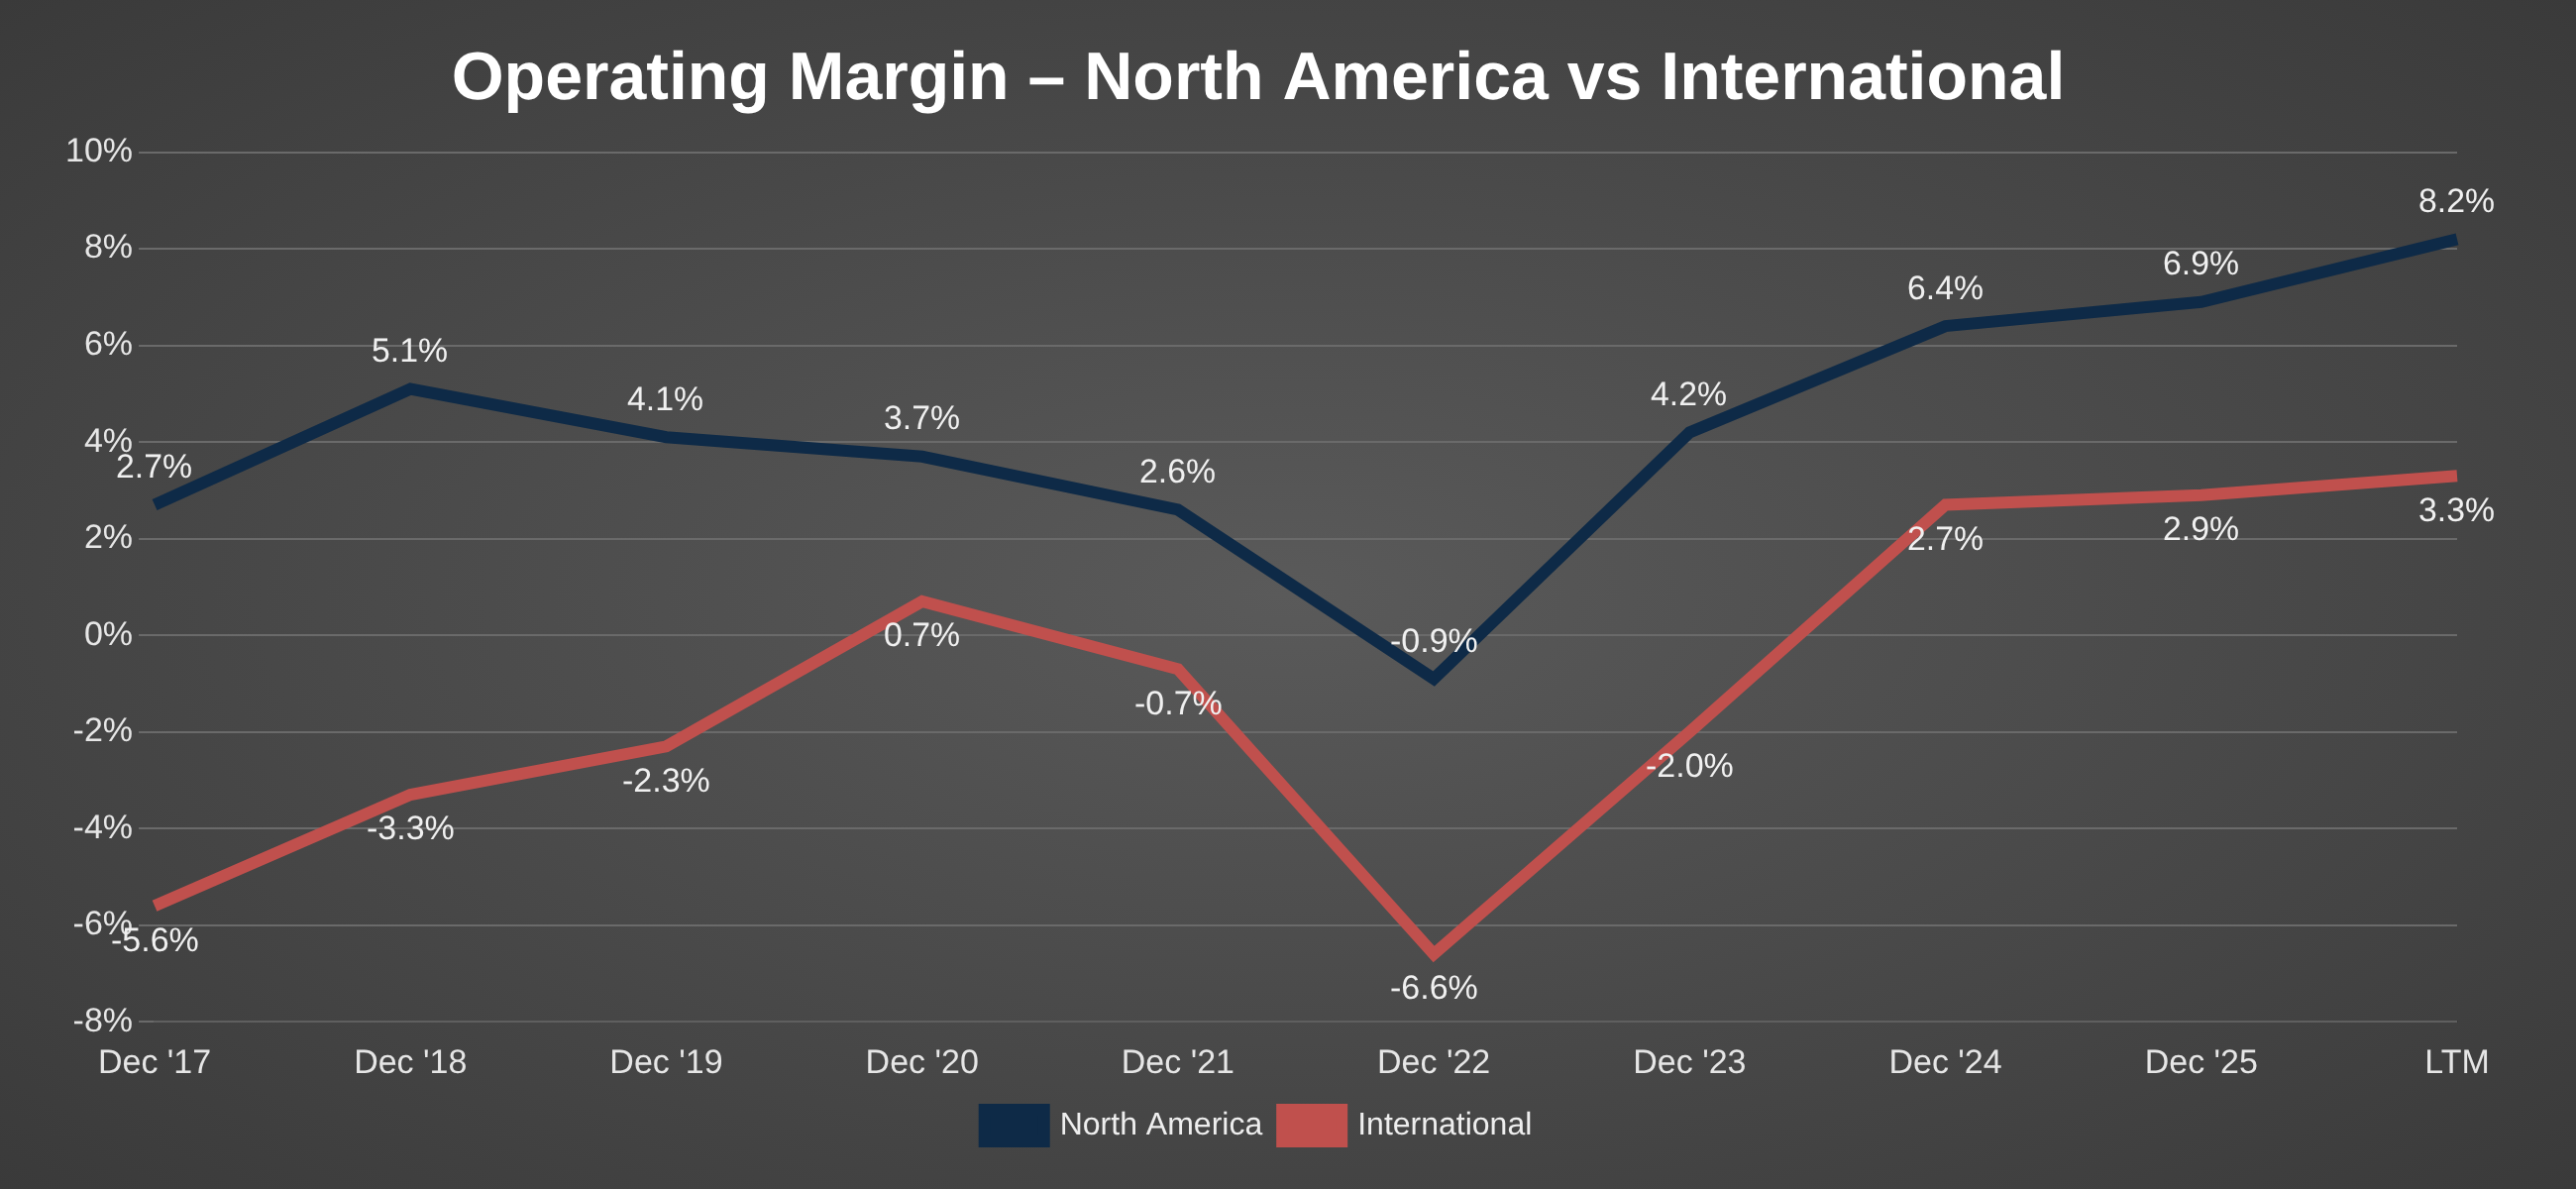
North America: 57.7% of revenue, operating margin 8.2% (TTM): retail, ads and subscriptions in the US and Canada. International: 22.0% of revenue, operating margin 3.3%: the same retail model in other countries, still thin but positive since 2024 (it lost 2.0% in 2023).
North America’s margin went from −0.9% in 2022 to 8.2% today. International still has room to move toward it, which supports a higher blended margin.
Business Segments
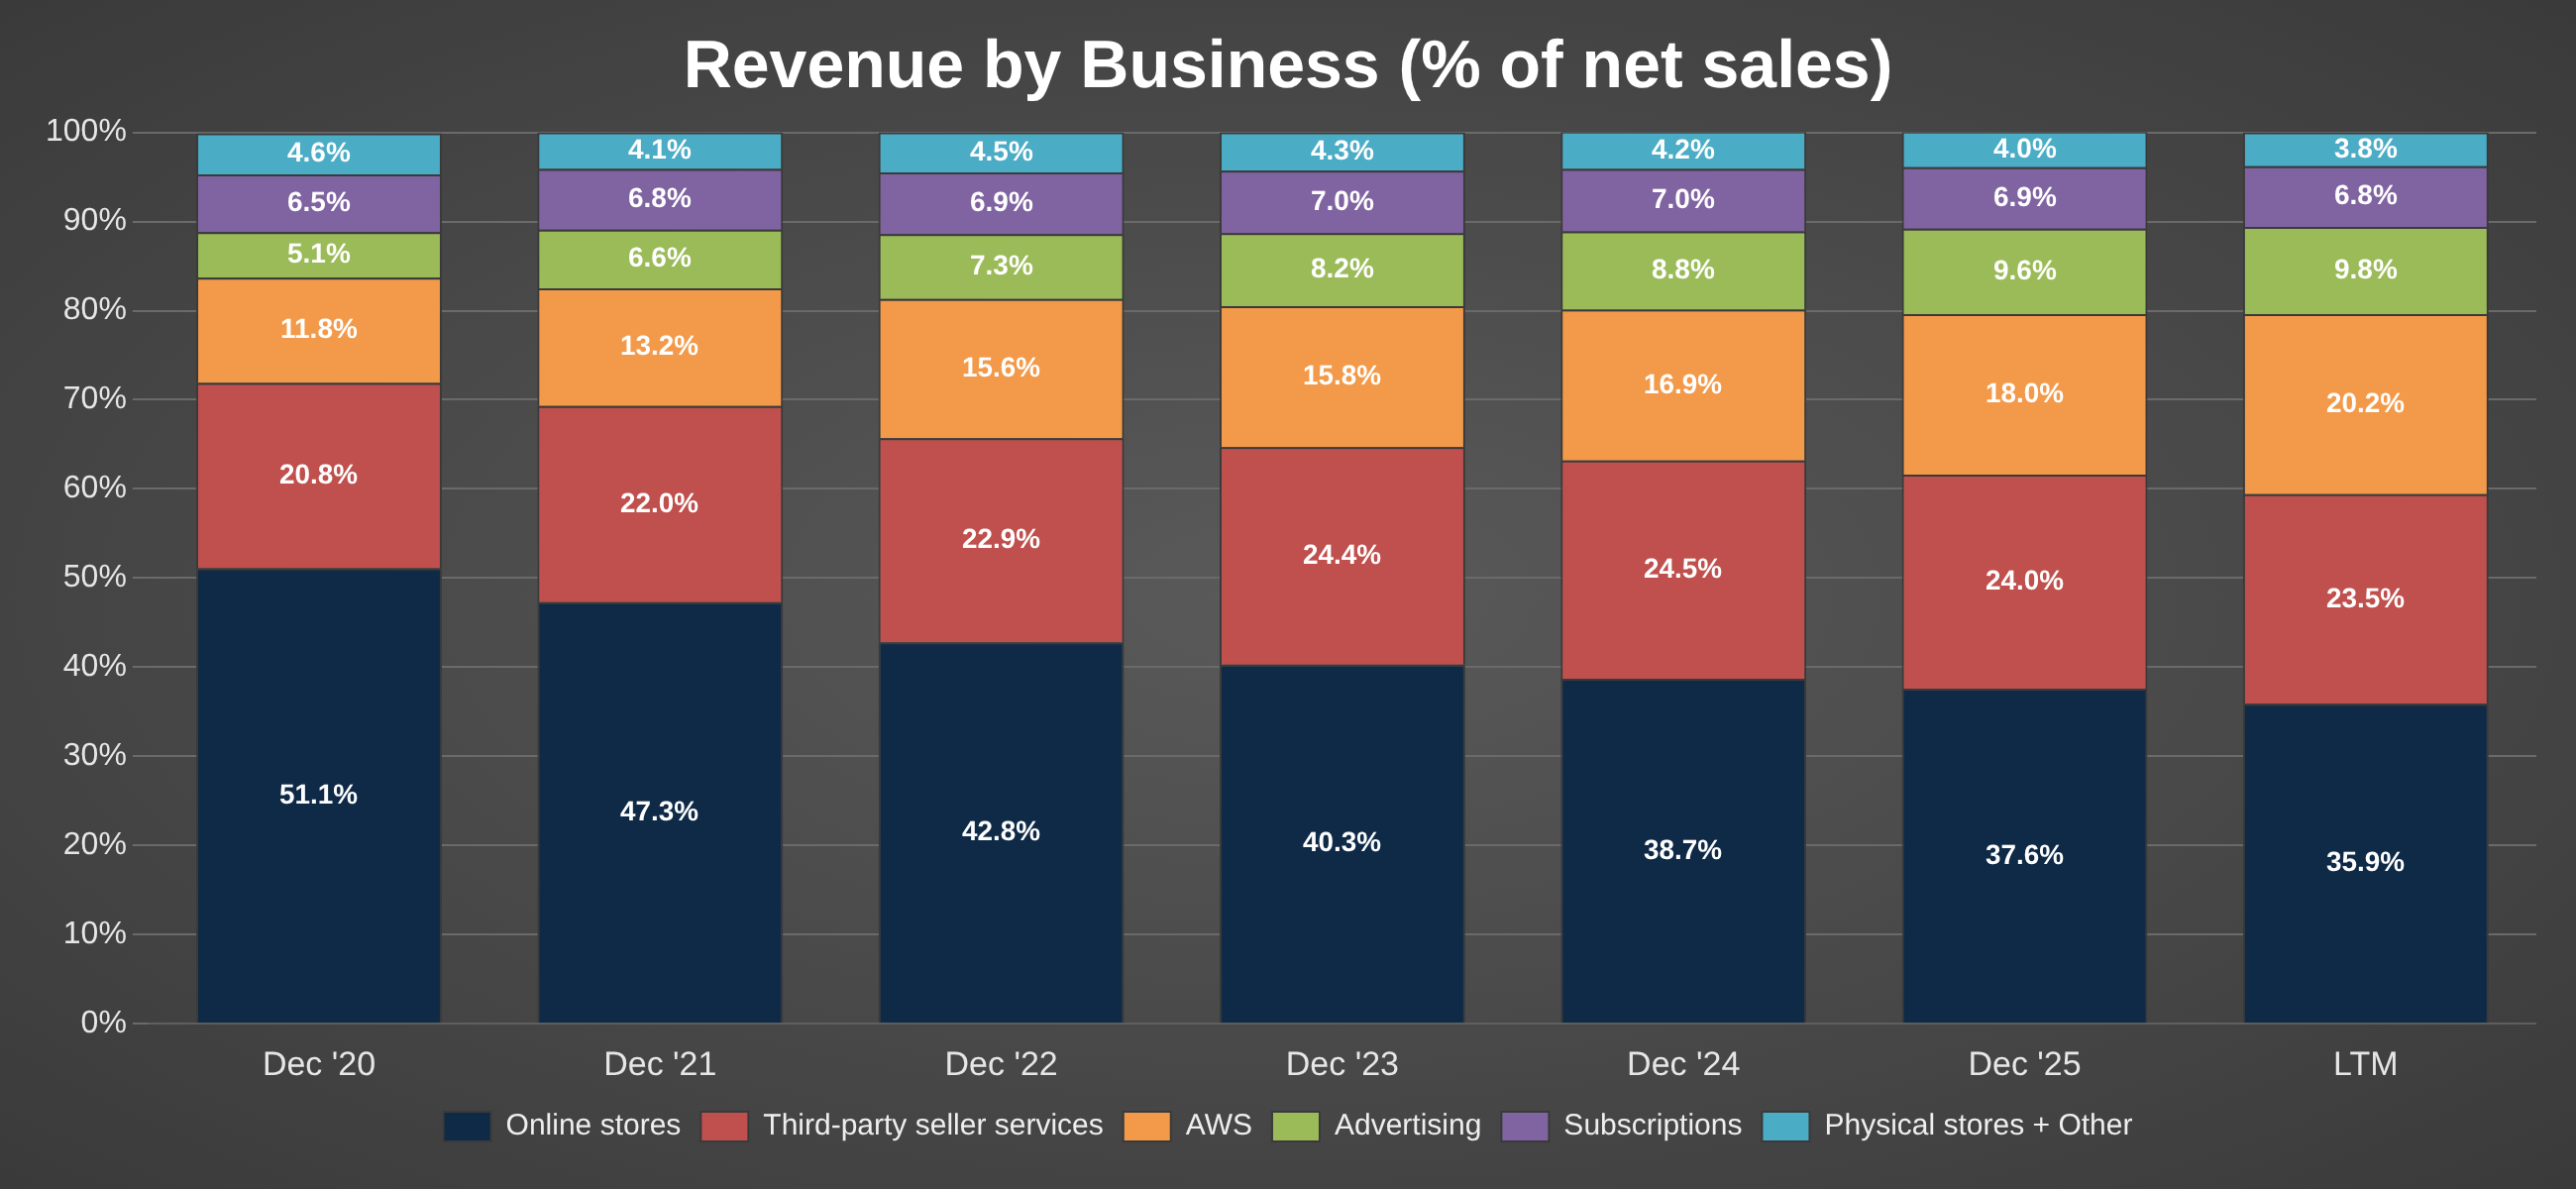
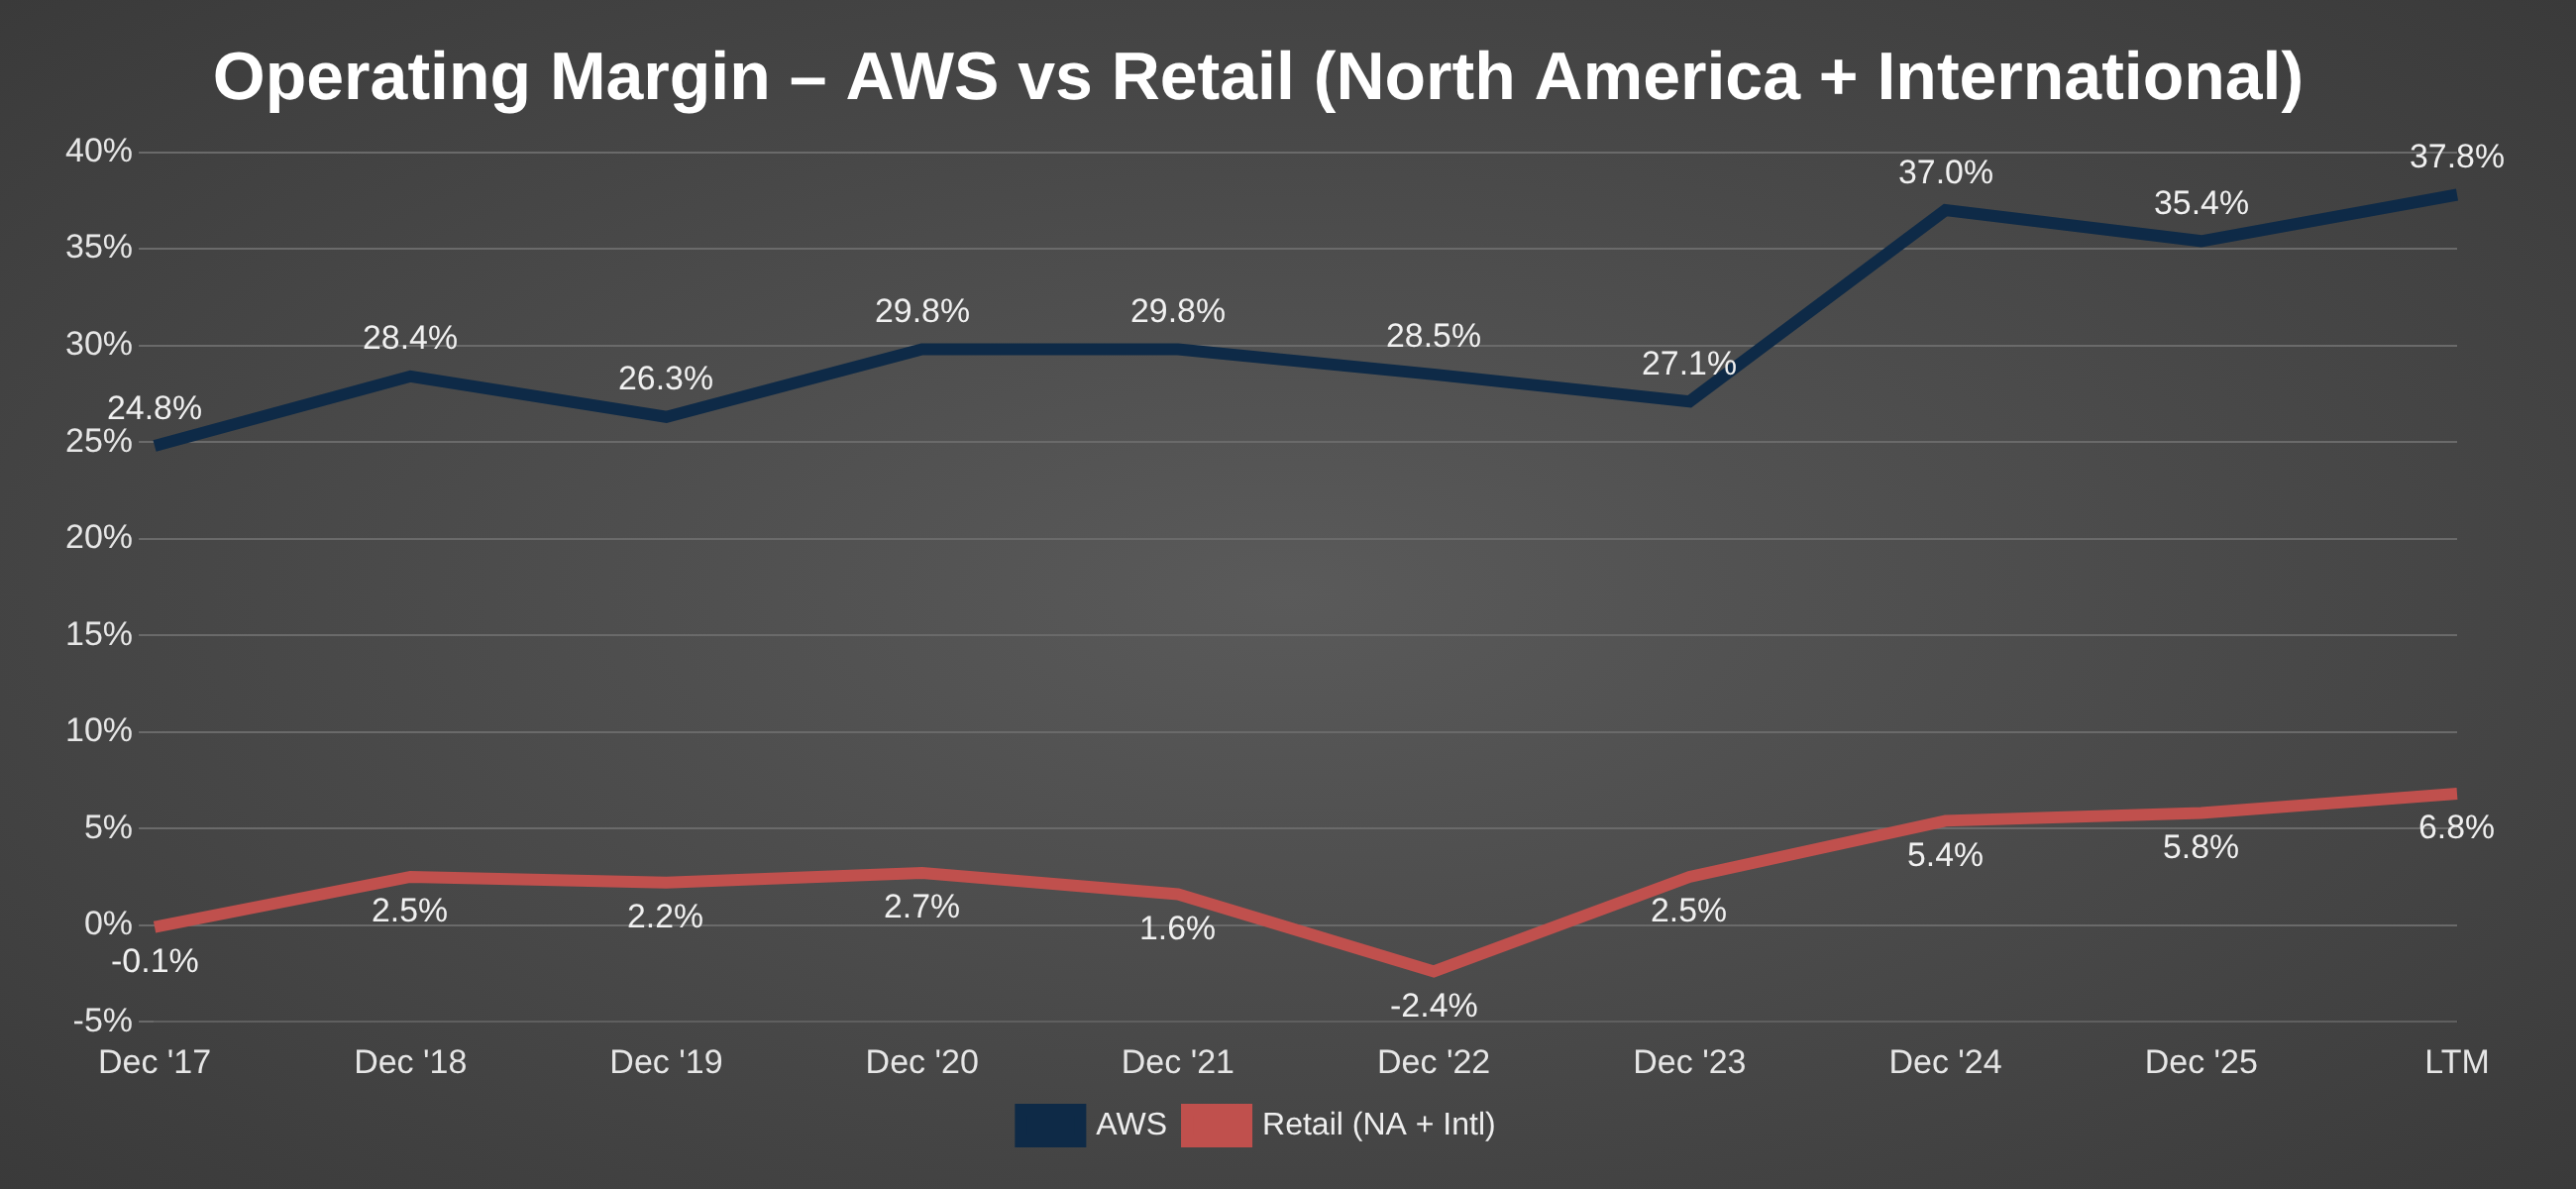
AWS: 20.2% of revenue, operating margin 37.8% (TTM): cloud computing. Its share of sales has gone from 11.8% in 2020 to 20.2%, and it makes 58% of the operating income (TTM, $61.0 billion of $104.4 billion). Advertising: 9.8%: high-margin and the fastest-growing retail line, not reported separately for margin. Third-party seller services 23.5% and subscriptions 6.8%: fees and memberships. Online stores 35.9%, physical stores and other 3.8%: Amazon’s own retail sales, now the lowest-margin part.
Retail (North America + International): operating margin 6.8% (TTM), up from −2.4% in 2022.
As AWS and ads take more of the revenue, the blended margin rises even if each part stays flat. AWS depreciation grew 65% in nine months ($24.6 billion vs $14.9 billion, 10-Q) as capex ramps, so its margin is the main risk to this logic.
Overall Operating Margin
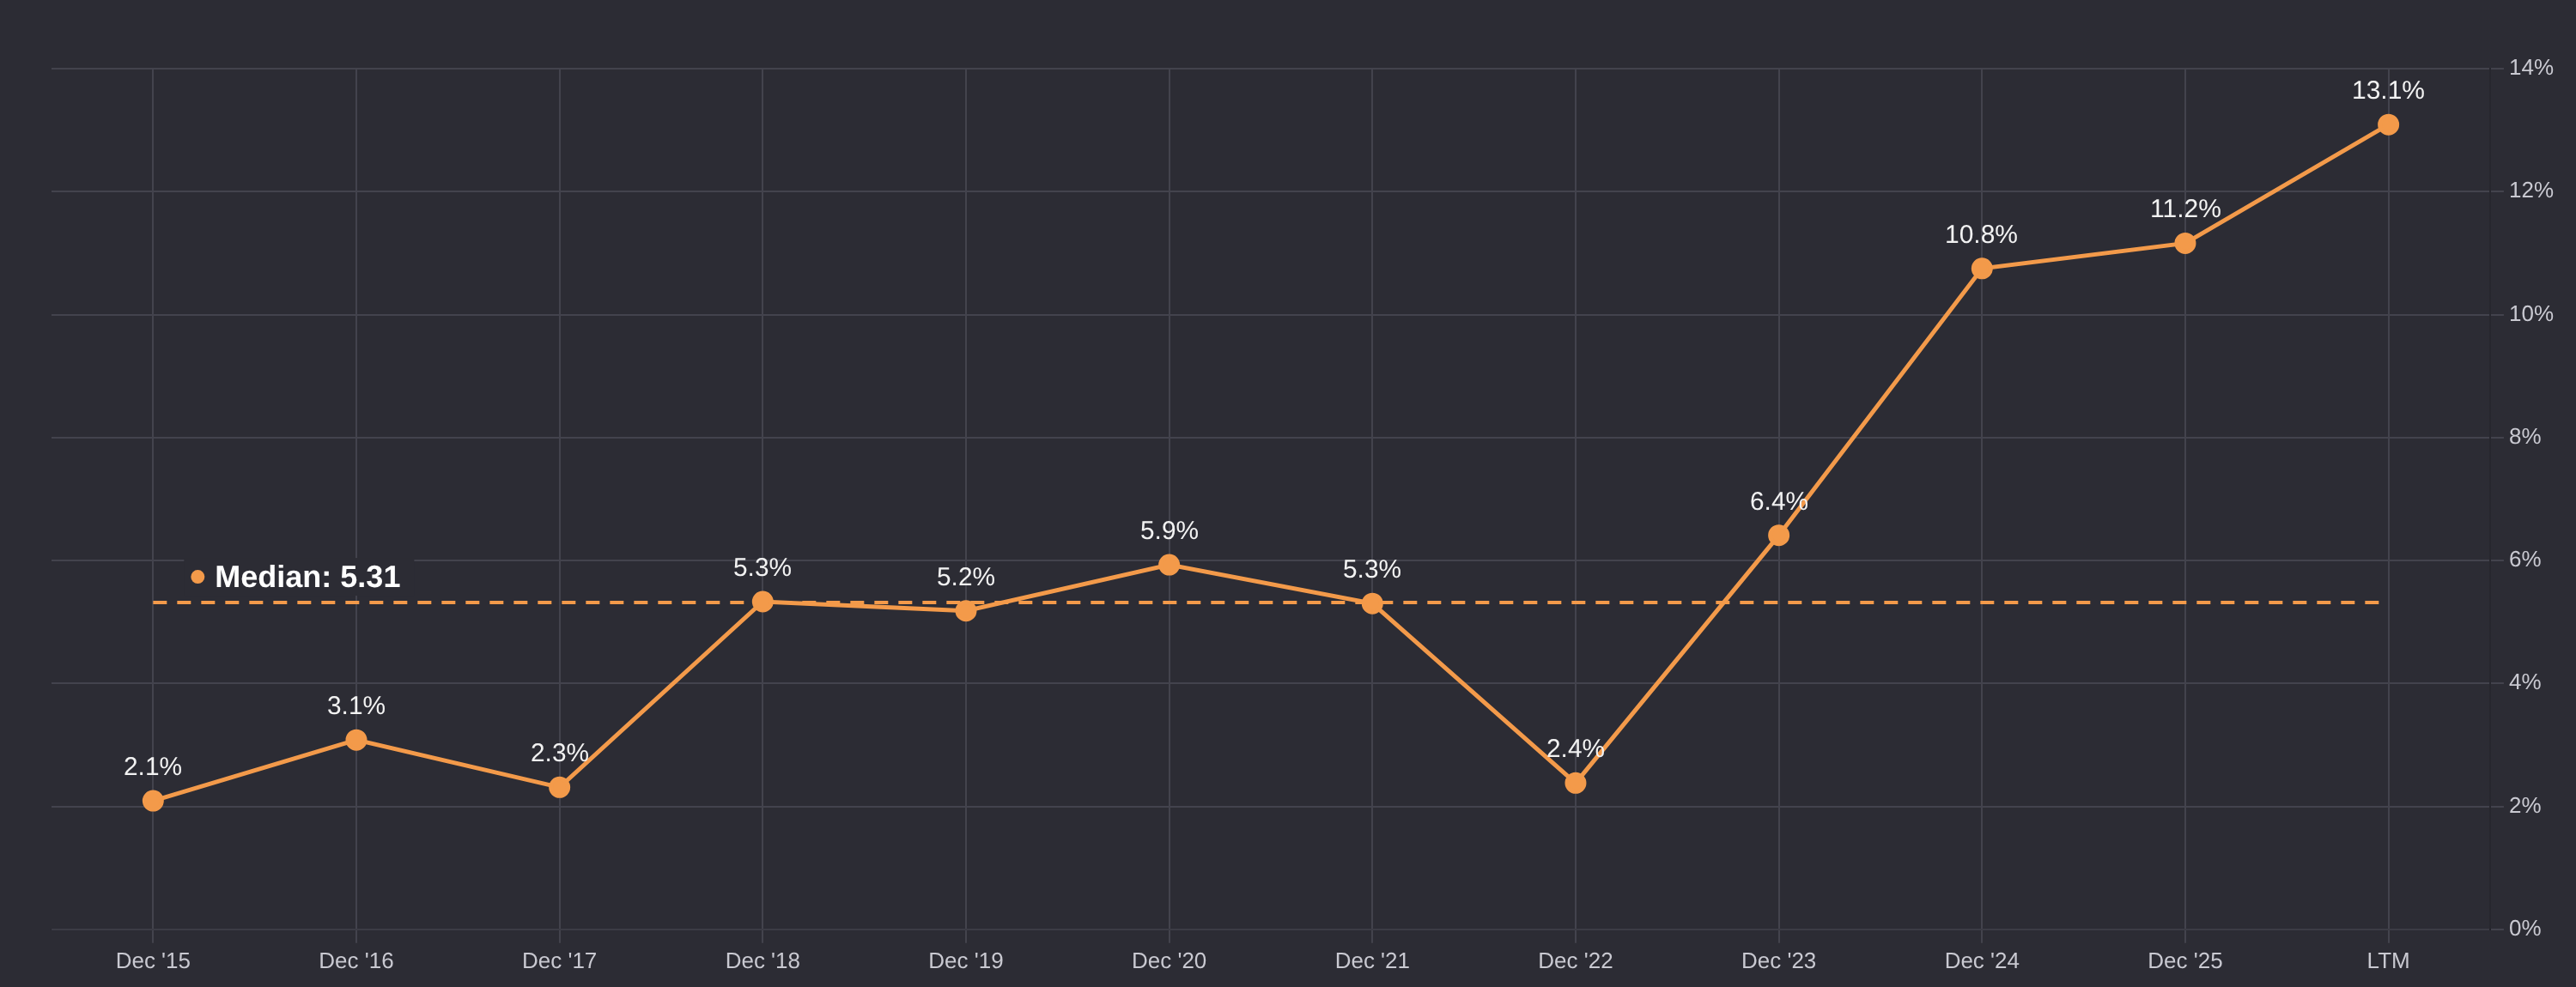
💡 Starts at 13% (Bad 12% · Good 14%) and converges to 16.5% (Bad 12.5% · Good 20%). The TTM margin is 13.1% against a 5.3% median since 2015. The terminal margin is built from the segments:
Base: AWS grows to ~28% of revenue at a ~33% margin (down from 38% on depreciation) = 9.2 points, plus retail at 72% of revenue earning ~10% = 7.2 points. Total ≈ 16.4%, rounded to 16.5%. The ~10% retail margin sits between North America’s 8.2% today and a mix with more ads (high margin, 9.8% of revenue and growing fastest), with International converging up from 3.3%.
Bad: AWS at ~25% of revenue and a 30% margin = 7.5 points, plus retail at 75% stuck at today’s ~6.7% = 5.0 points. Total = 12.5%, just under today’s 13.1%.
Good: AWS at ~30% of revenue and a 37% margin = 11.1 points, plus retail at 70% earning ~12.7% = 8.9 points. Total = 20%. The 12.7% is solved to reach 20%: it nearly doubles today’s 6.8%, which is why it is the Good case.
Sales / Capital ratio (Reinvestment)
Revenue generated per dollar of invested capital. Investments can take a few years to turn into sales.
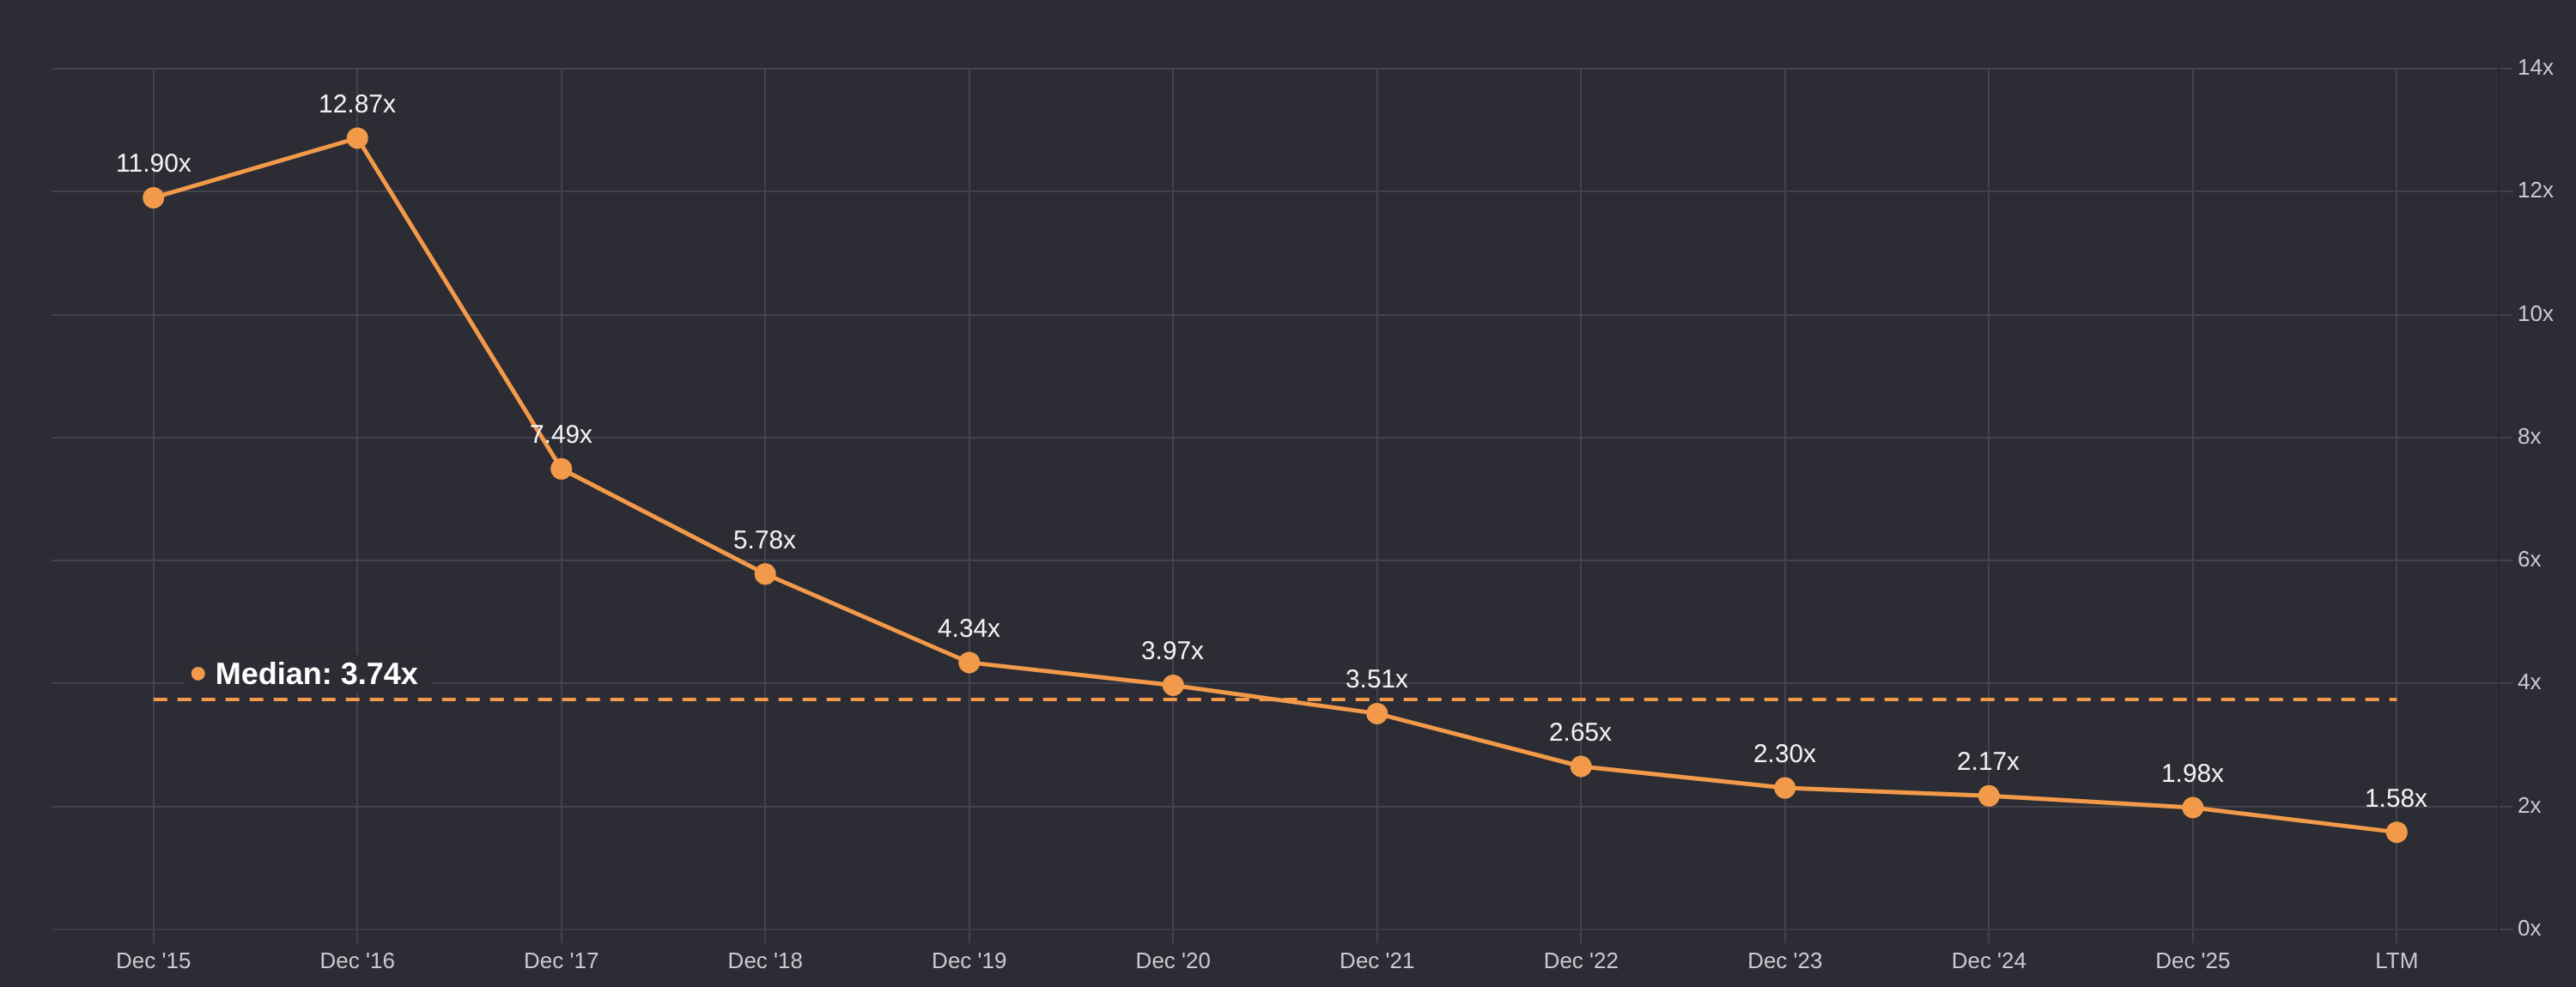
💡 Starts at 0.8 (Bad 0.6 · Good 1.0) and converges to 1.6 (Bad 1.1 · Good 2.2). The ratio has fallen from a 3.7 median to 1.58 (TTM) as capex doubled. Base assumes the new capacity produces sales slowly, so new growth costs more capital than in the past, then recovers toward 1.6 as it fills. Invested capital excludes the non-operating investments.
ROIC
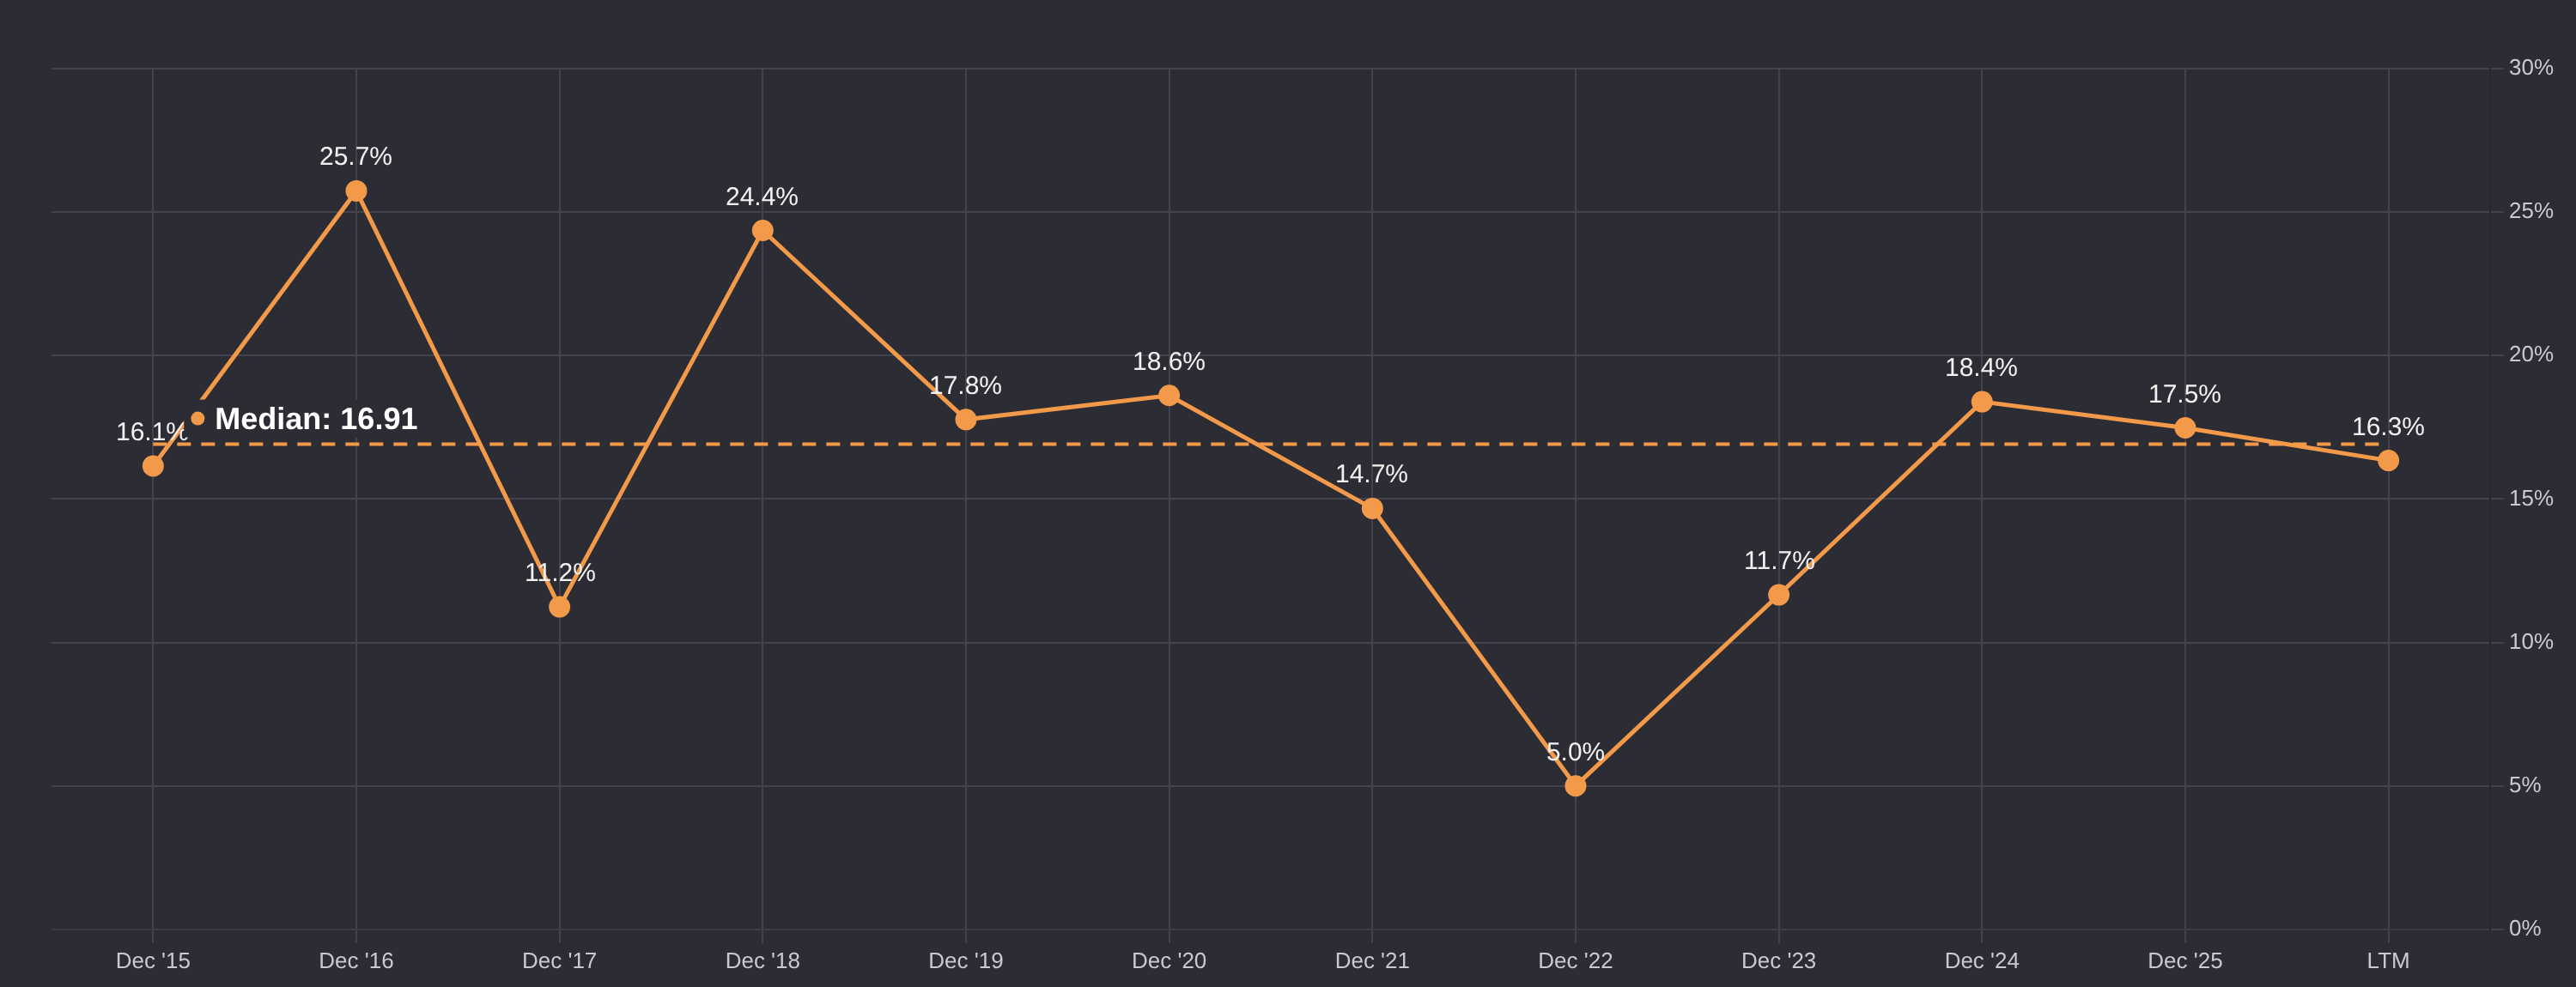
💡 Terminal ROIC 14% (Bad 10% · Good 18%), above the 9.5% cost of capital. I set it below what margin × capital gives (Base 16.5% × (1 − 22.5%) × 1.6 = 20.5%, Good 34%, Bad 10.7%, today 16.0%), because competition and heavy depreciation should erode the return on new capital. ROIC was 16.3% TTM and 13.4% on average over five years (median 16.9% since 2015, which includes the high-ROIC retail years). Base sits near the five-year average. Bad is near the cost of capital if the AI build-out earns little. Good returns to the 2024–25 level.
Discounted Cash Flows (Weight: 60%)
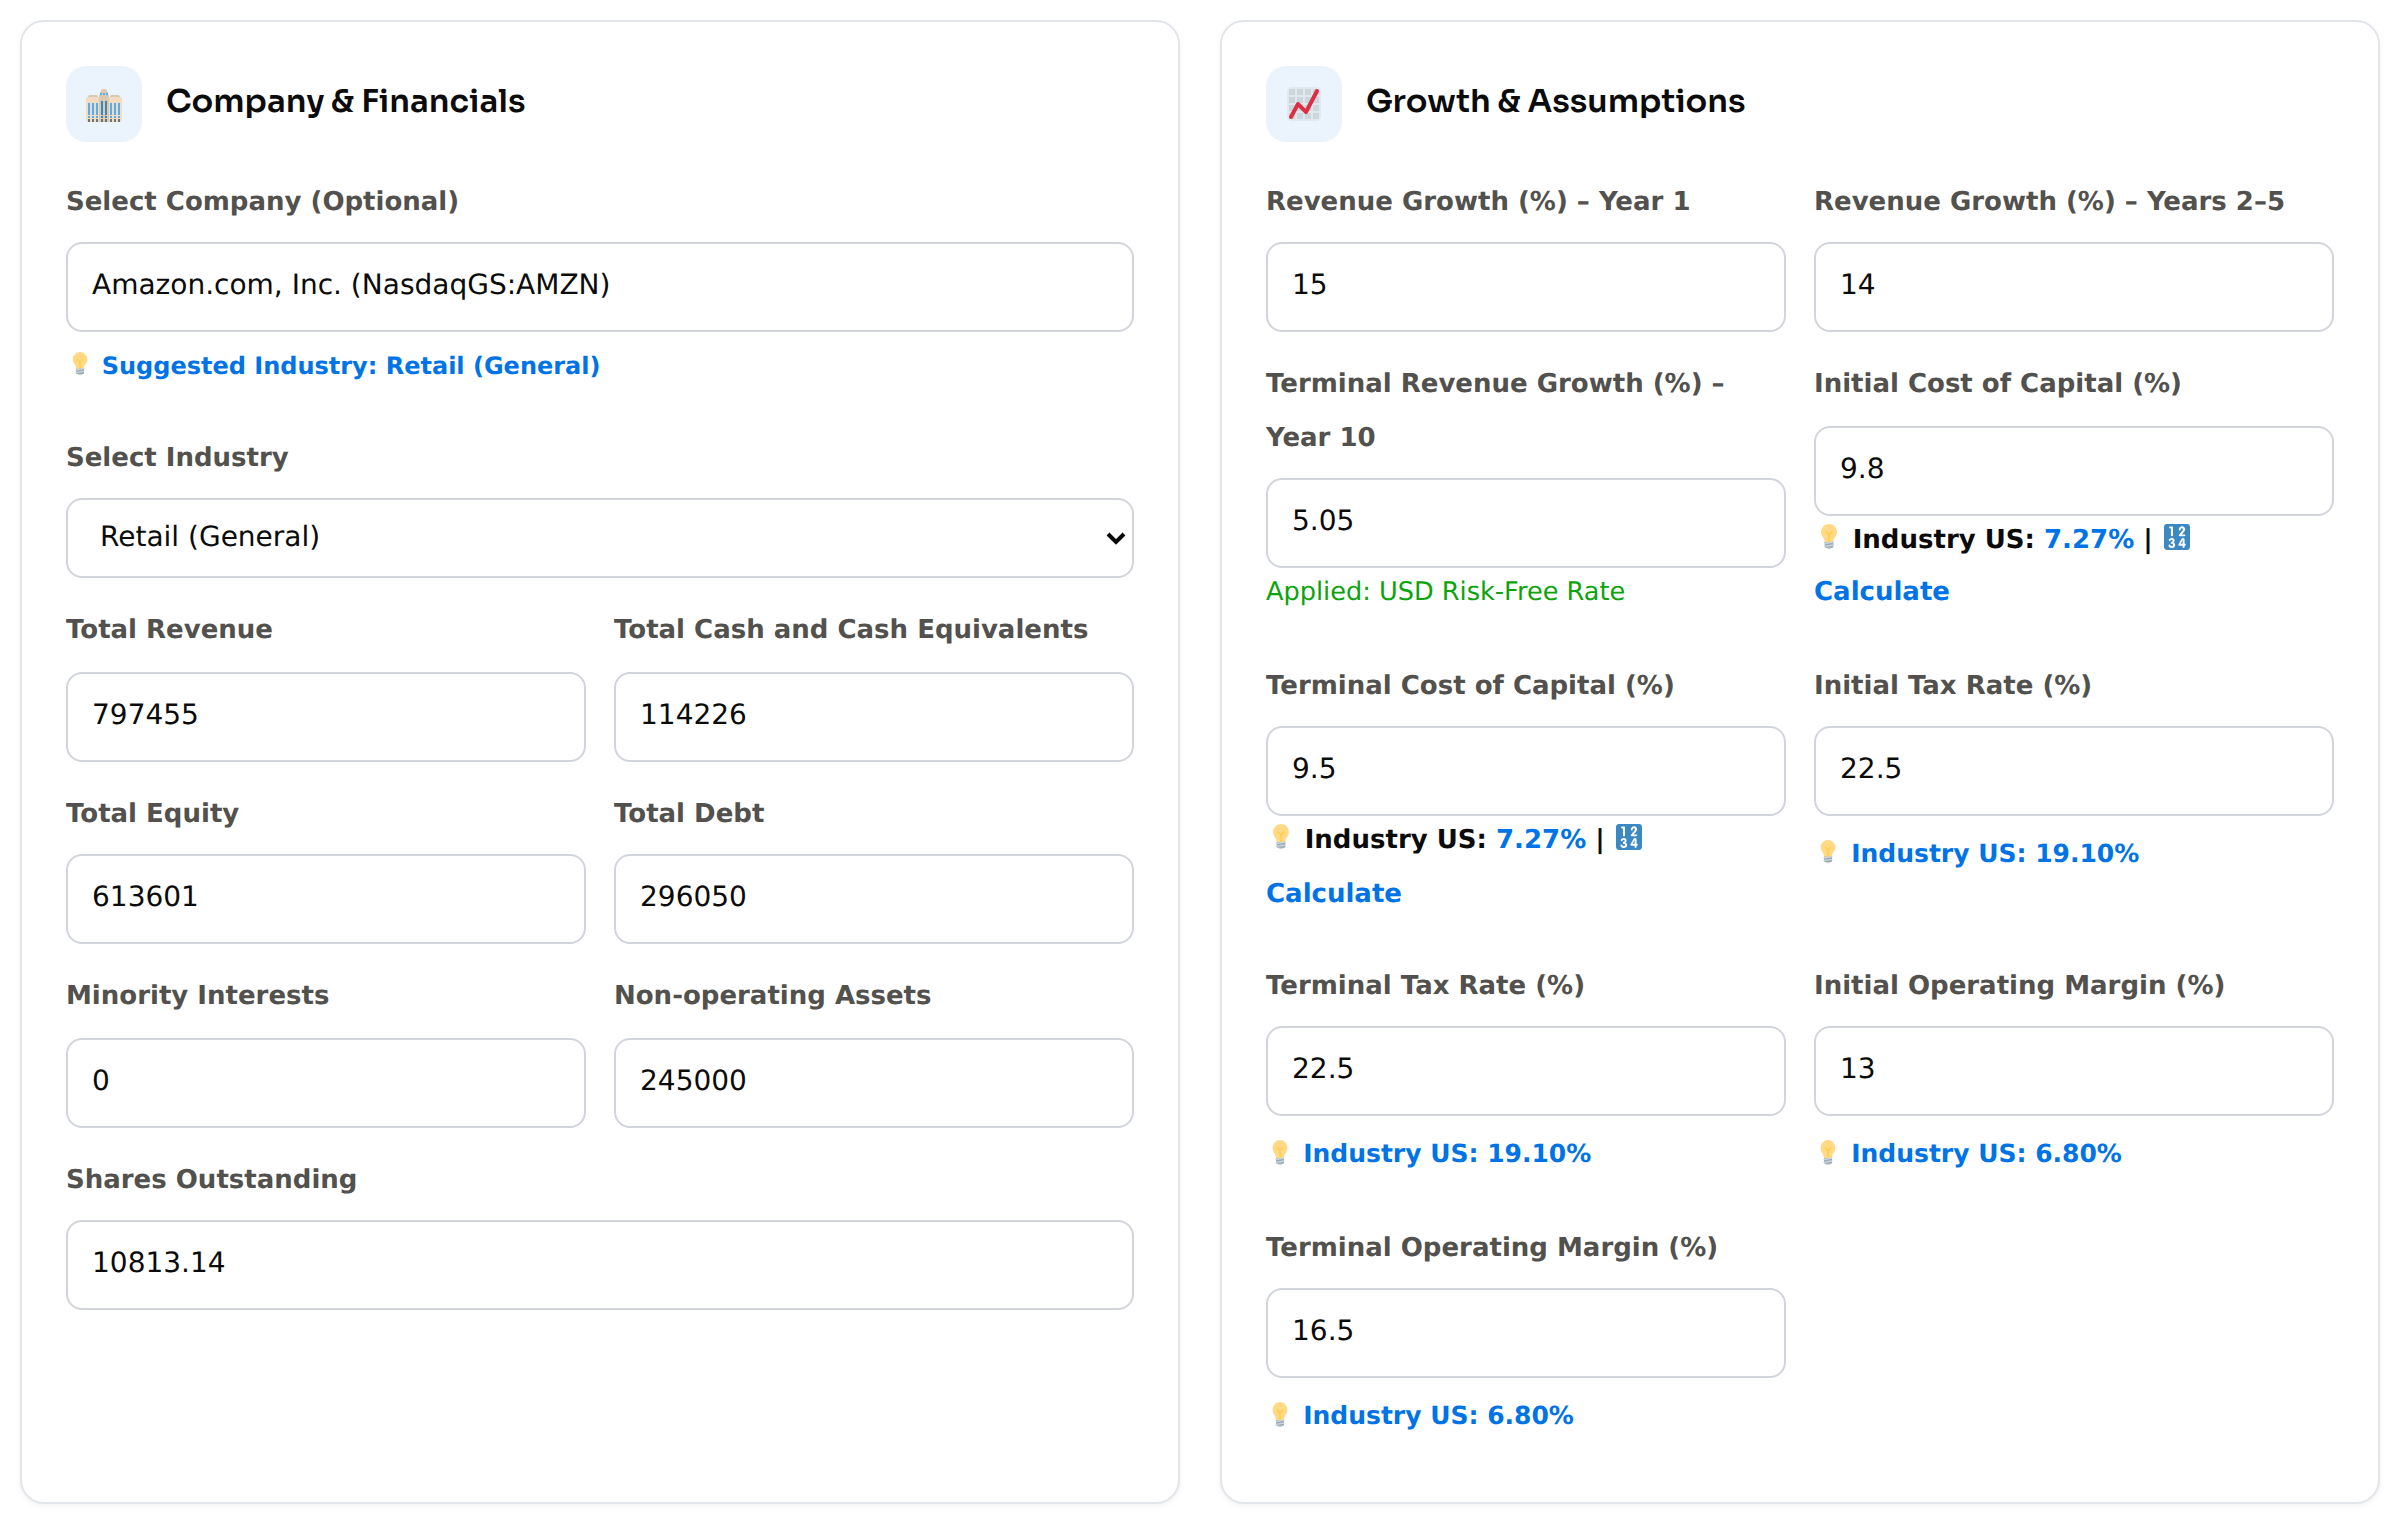

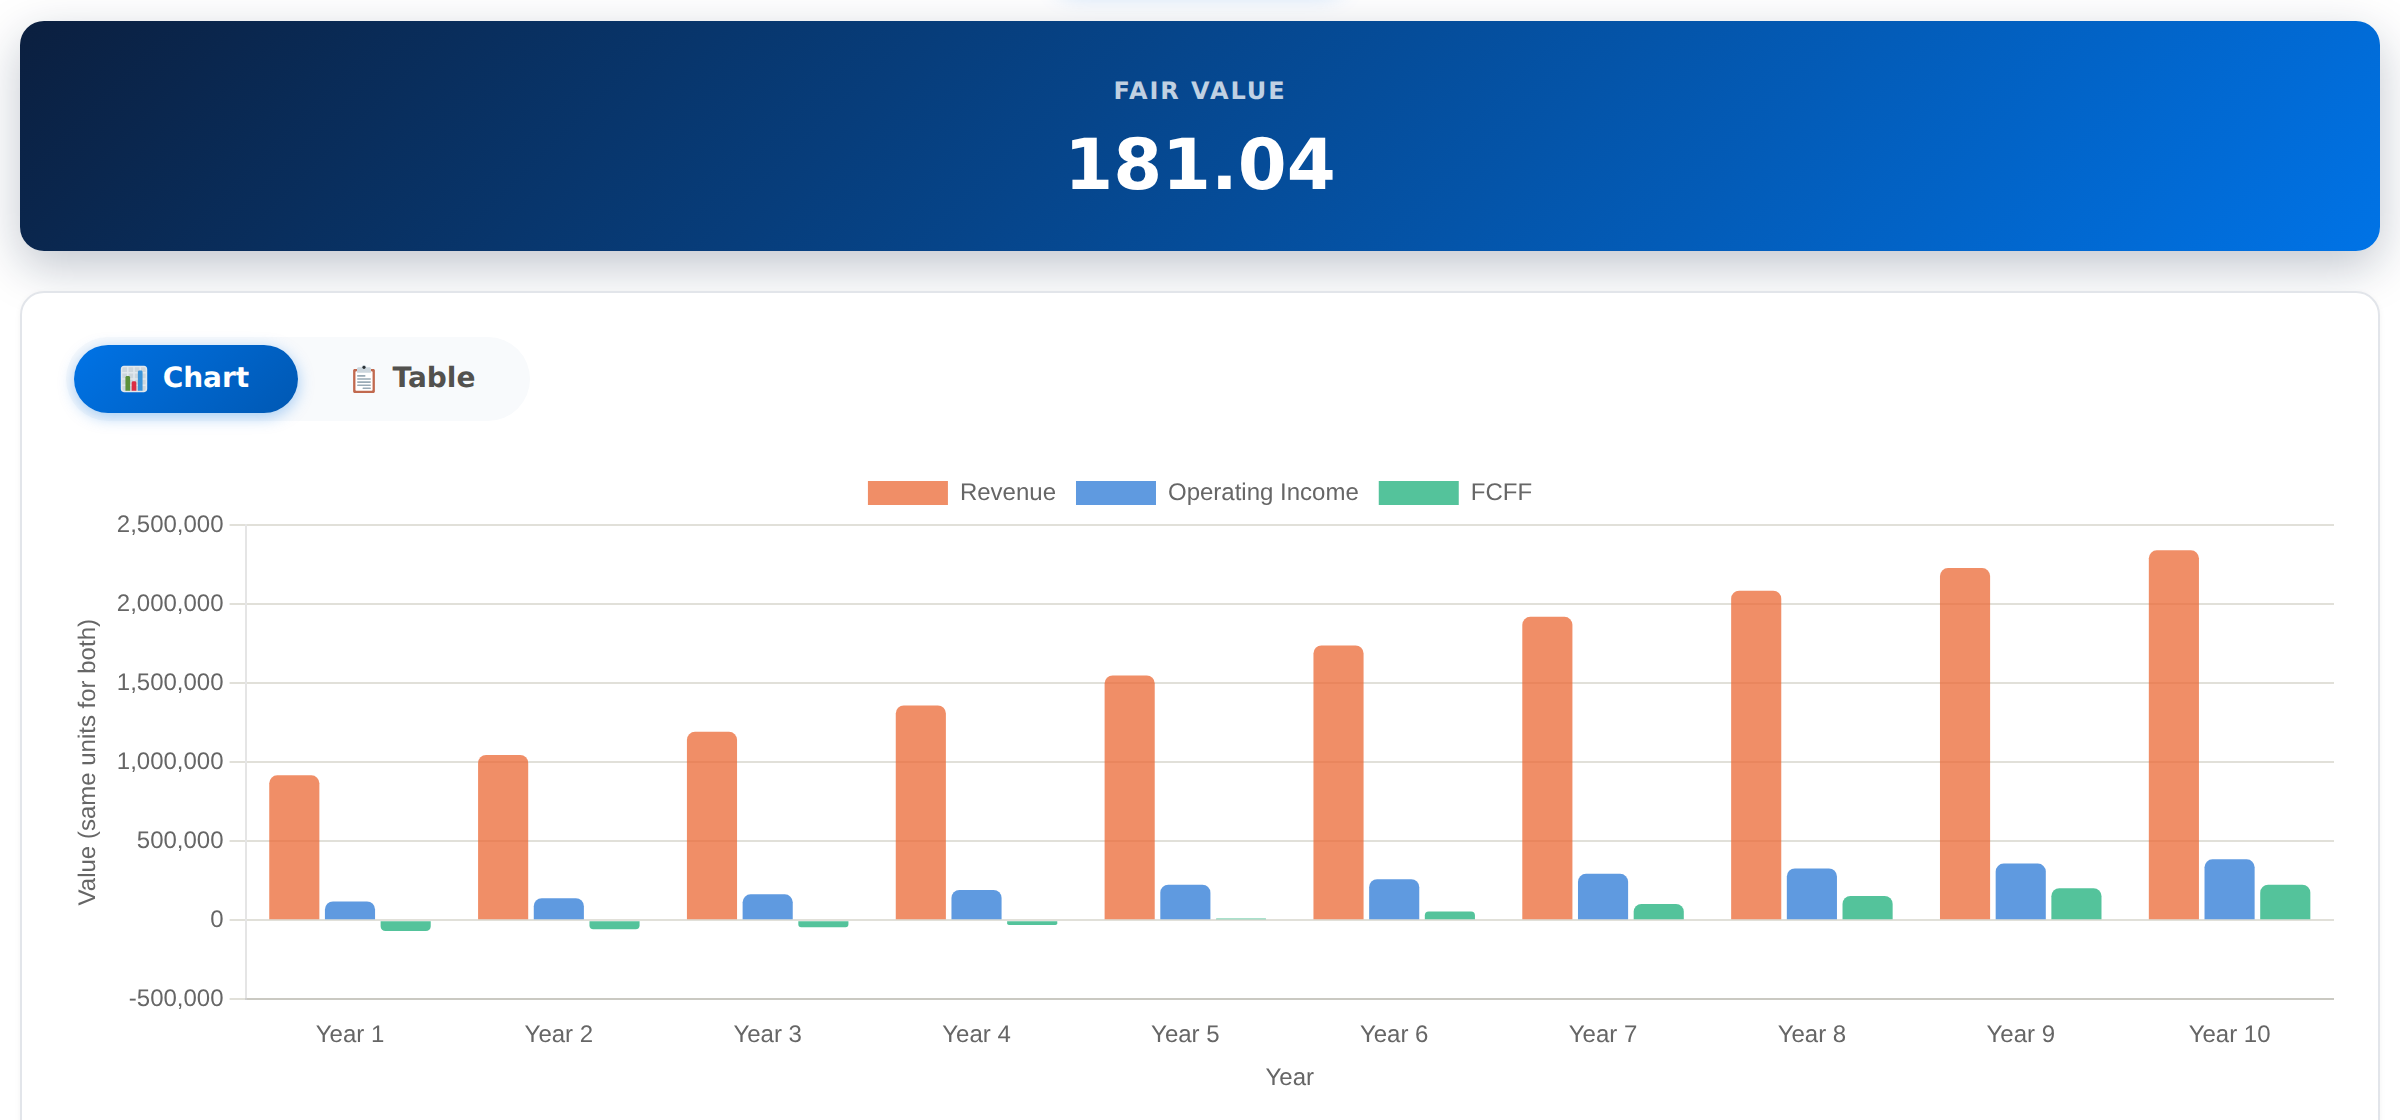
Where the inputs come from:
Total Revenue: trailing twelve months to September 2026 (10-Q).
Cash: cash plus short-term investments, $114.2 billion (balance sheet, Sep 2026).
Total Debt: $296.1 billion, all borrowings plus finance and operating leases, as in the Cost of Capital section.
Non-operating Assets: $245 billion. Private equity investments are carried at $143.7 billion (10-Q, Note 2): Anthropic preferred stock ($92.5 billion) and OpenAI preferred stock ($50.0 billion Series C) plus $1.2 billion of other private investments. The Anthropic convertible notes are carried at $146.2 billion and listed holdings at $4.1 billion. Together that is about $294 billion. Most of the Anthropic value is an unrealised gain that will be taxed when realised, and these are illiquid private stakes, so I take the Anthropic part ($238.7 billion) net of 20% tax on the whole carrying value ($190 billion; this overstates the tax a little, because the cost basis isn’t taxed), and add the OpenAI stake and the other private investments ($51.2 billion, bought in 2026, so almost no gain to tax) and the listed holdings ($4 billion) at face value. The OpenAI stake is also tied to AWS demand (OpenAI is an AWS customer), so some of its value overlaps with AWS growth.
Terminal Revenue Growth: the risk-free rate (5.05%), as a proxy for long-term economic growth.
Tax Rate: 22.5% for both initial and terminal, the underlying rate explained in the Cost of Capital section. Earlier years were 12–20% (2020–2025, apart from 2022, a loss year with a tax benefit), and the industry average is ~19%, but 2026 quarters have been ~23% once the Anthropic tax is removed.
Everything else: the assumptions above.
DCF fair value: $181.04.
The Monte Carlo simulation runs 1,000,000 DCFs, drawing each input between its Bad and Good values (Base is the most likely):
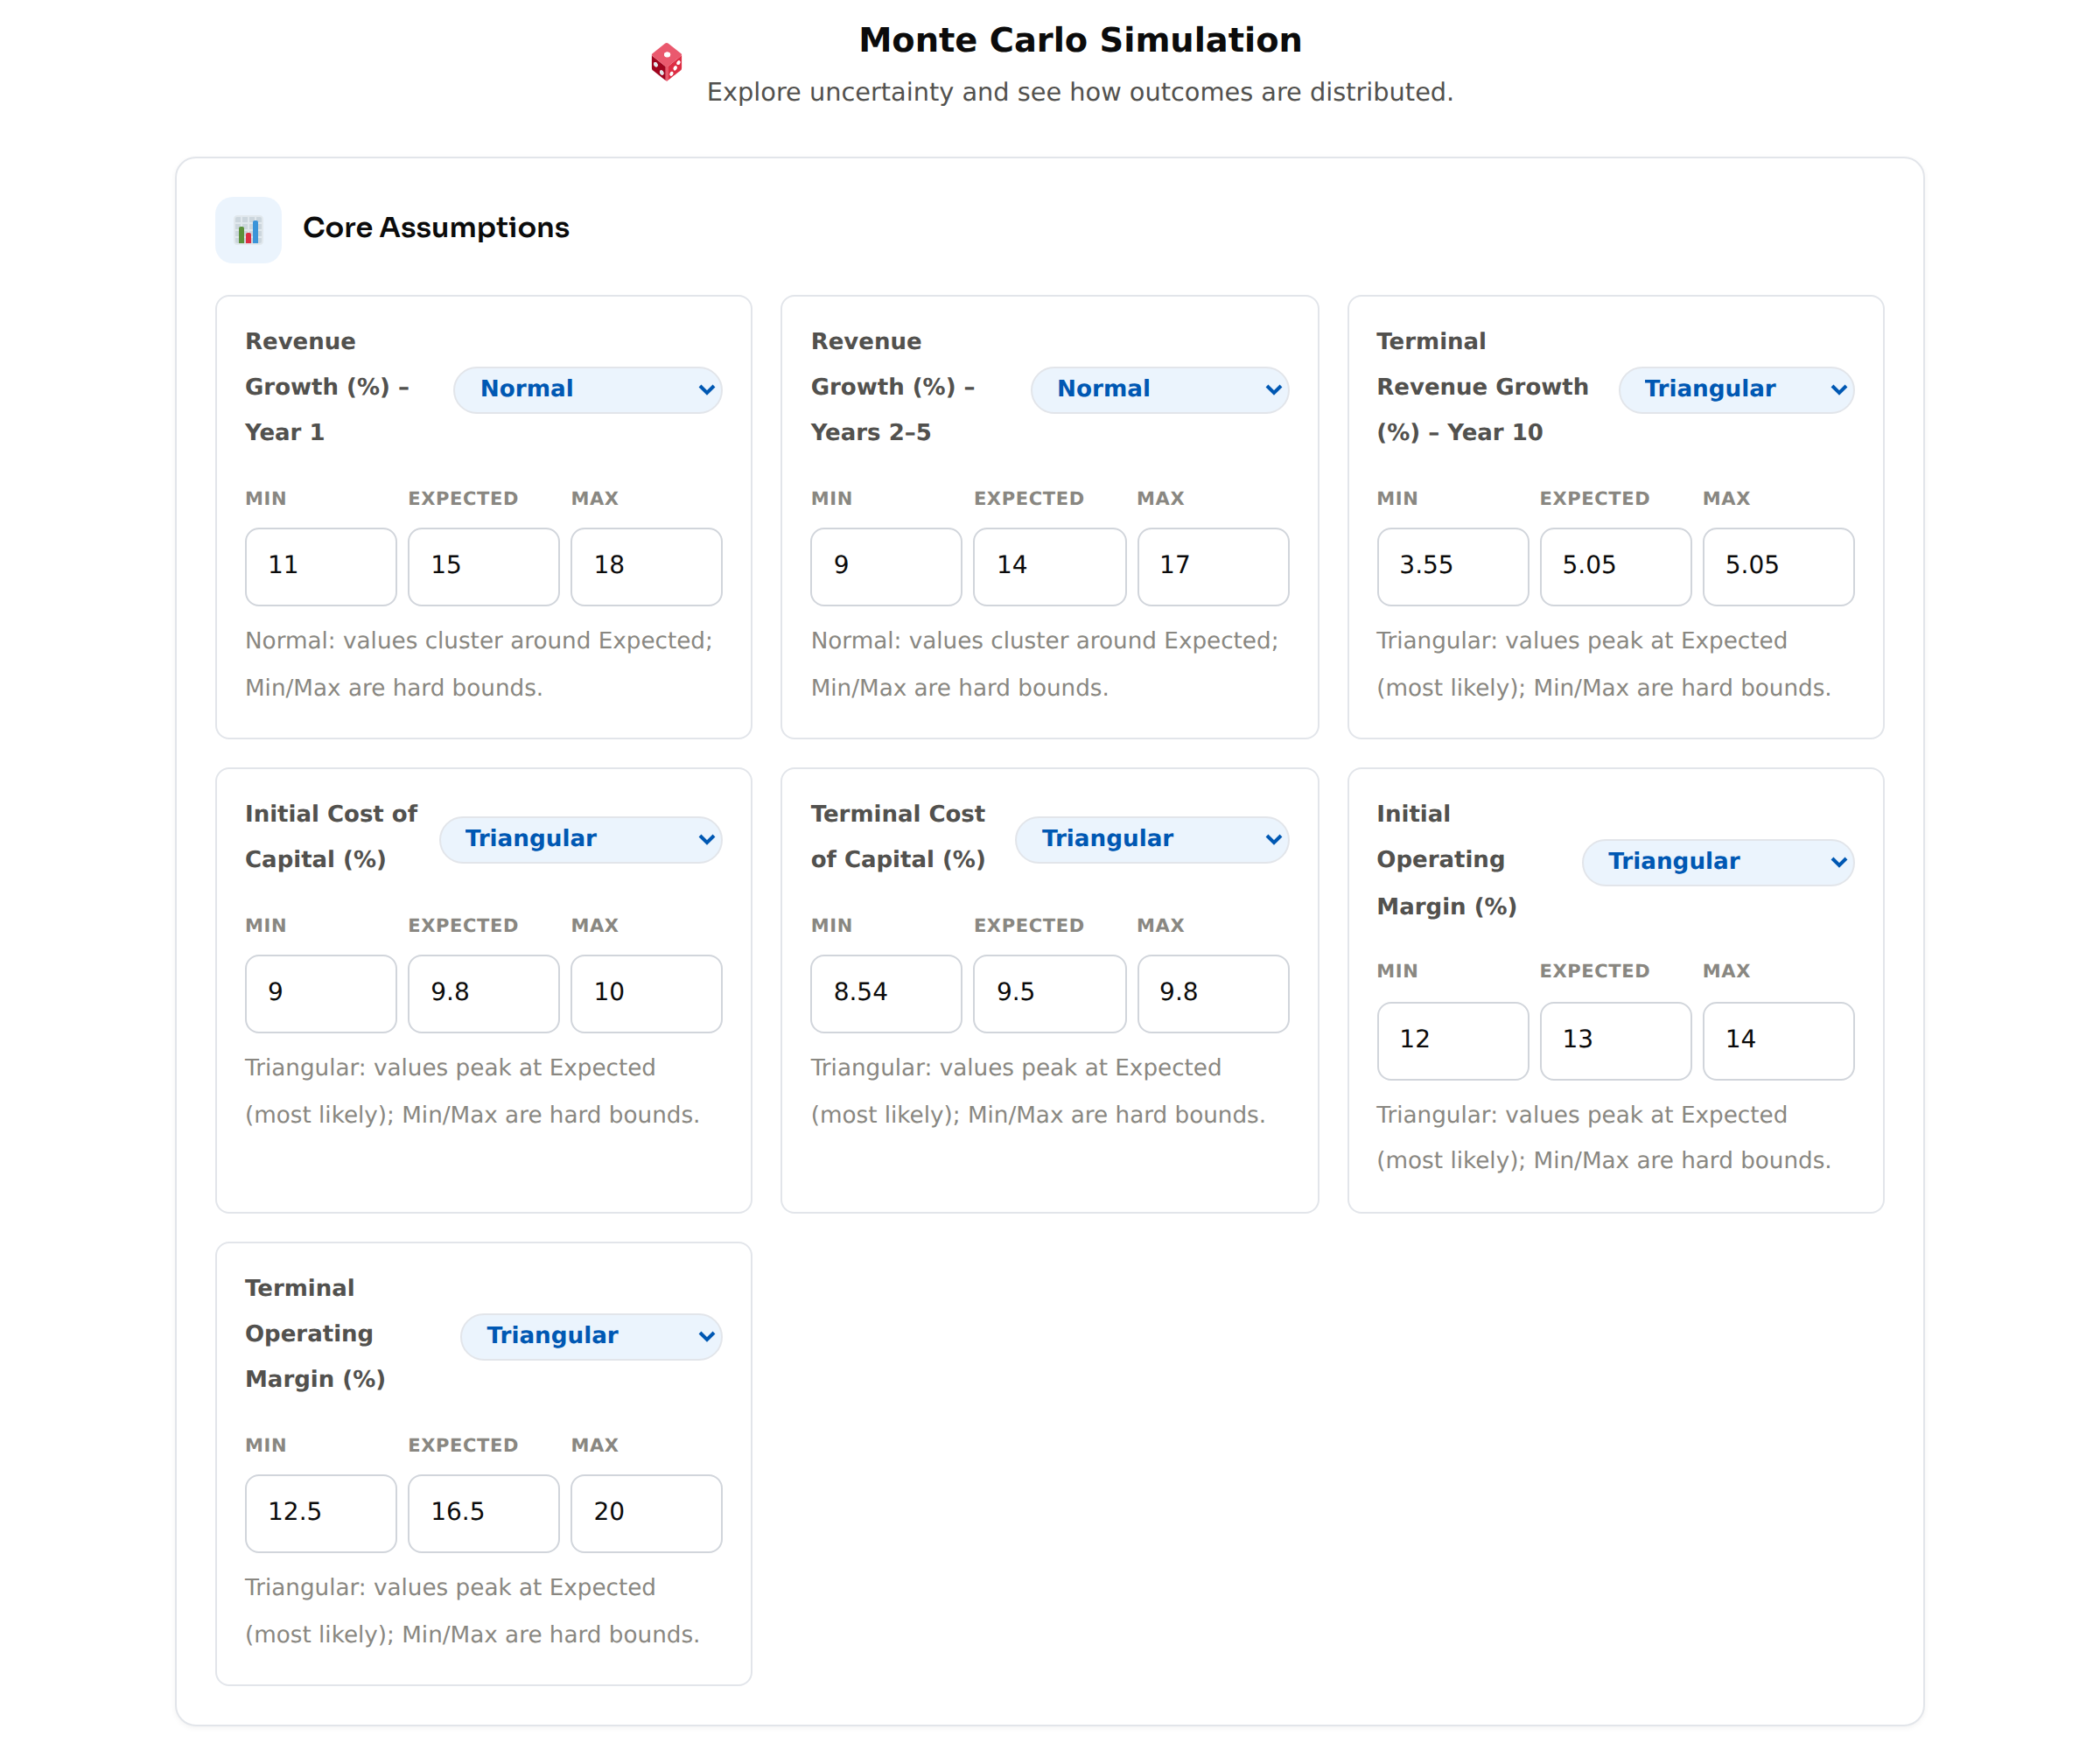
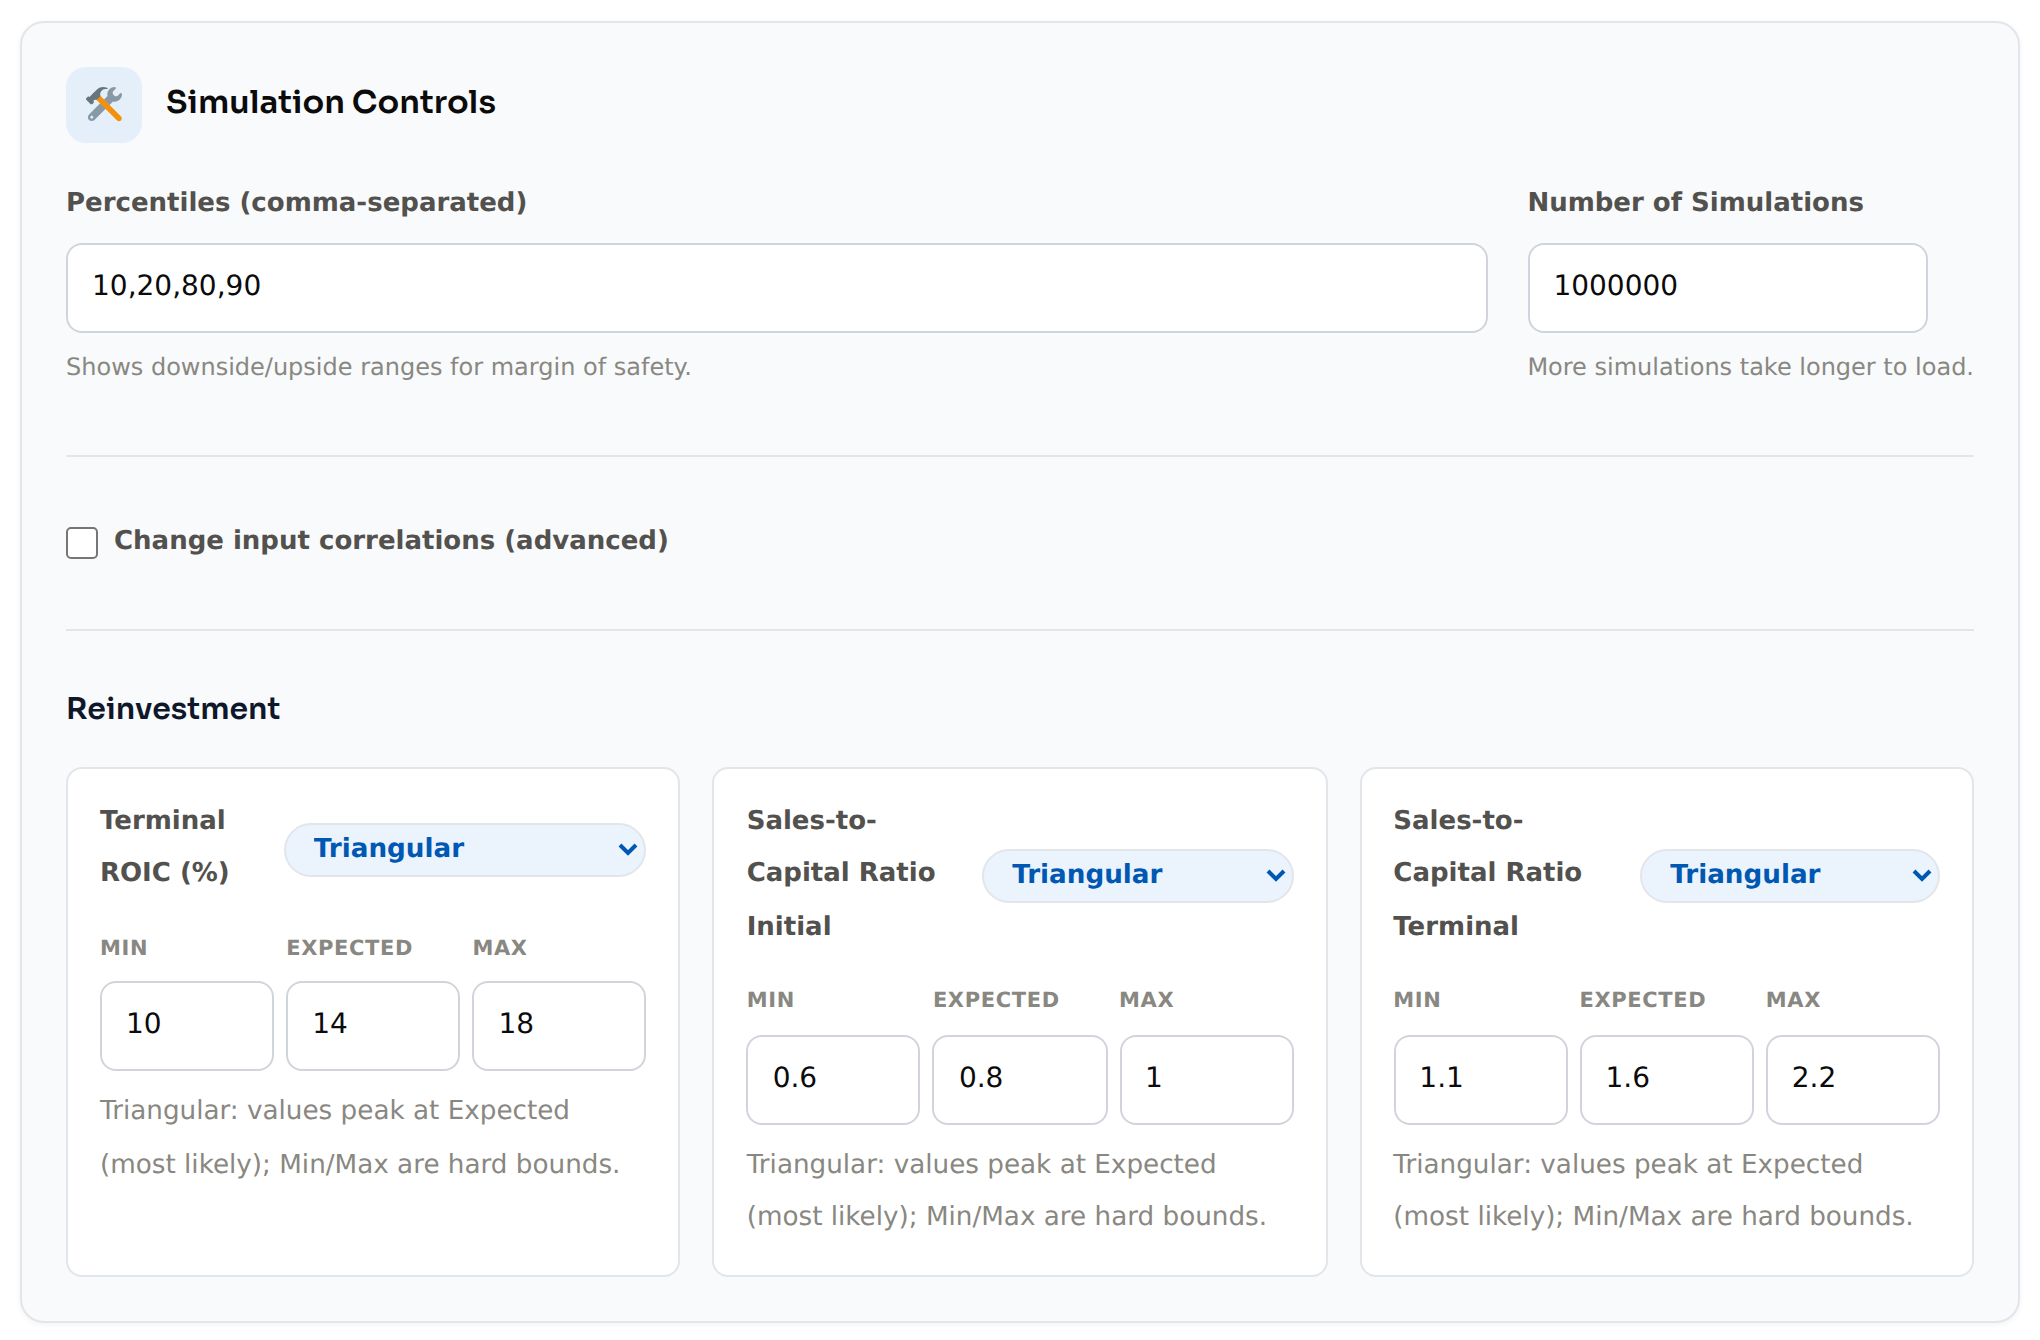
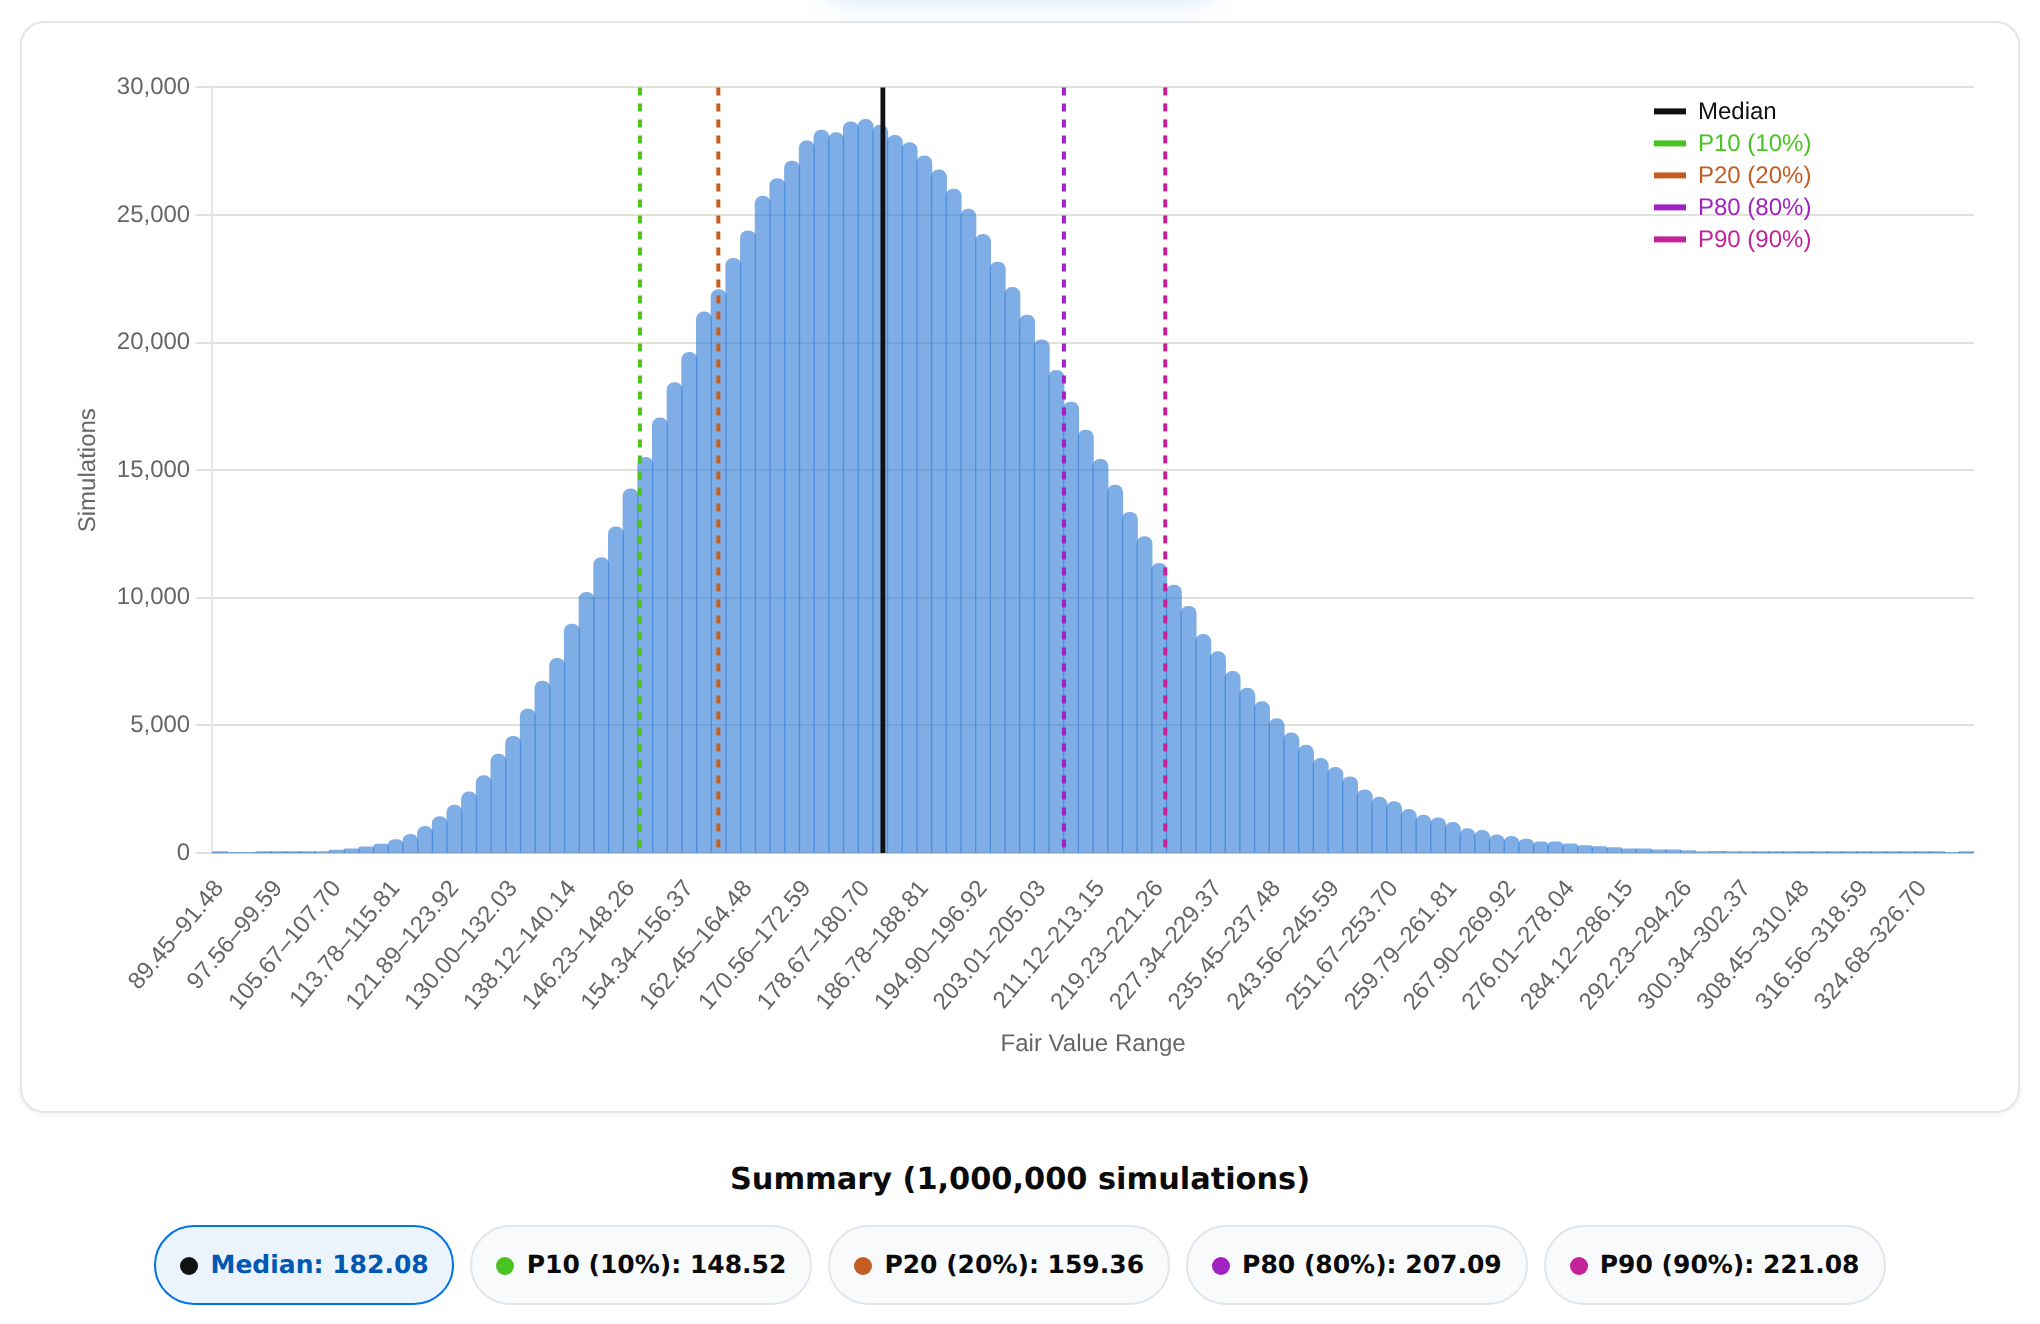
At $237.84, the price is above P90 ($221.08): Amazon looks overvalued on this method (more than 90% of simulations give a lower value, and the median is $182.08).
Try it yourself: DCF – The Fair Value Journal
EPS Growth (Weight: 40%)
TTM EPS: $12.37 (diluted, 10-Q Sep 2026), but it includes ~$69.8 billion of non-operating gains. I use core EPS of $7.44: operating income plus net interest ($104.4 billion + $4.7 billion − $4.5 billion), taxed at 22.5% and divided by 10,903 million diluted shares.
Revenue Growth (CAGR)
1 Year | 3 Years | 5 Years | 10 Years |
|---|---|---|---|
12.38% | 11.73% | 13.18% | 20.95% |
💡 14.2% a year (Bad 9.4% · Good 17.1%). It is the same path as the DCF (15% in year 1 then 14%, Bad 11% then 9%, Good 18% then 17%), a point above the 13.2% five-year rate because AWS is accelerating. Bad is 4.8 points lower and Good is 2.9 points higher.
Shares Outstanding (CAGR)
1 Year | 3 Years | 5 Years | 10 Years |
|---|---|---|---|
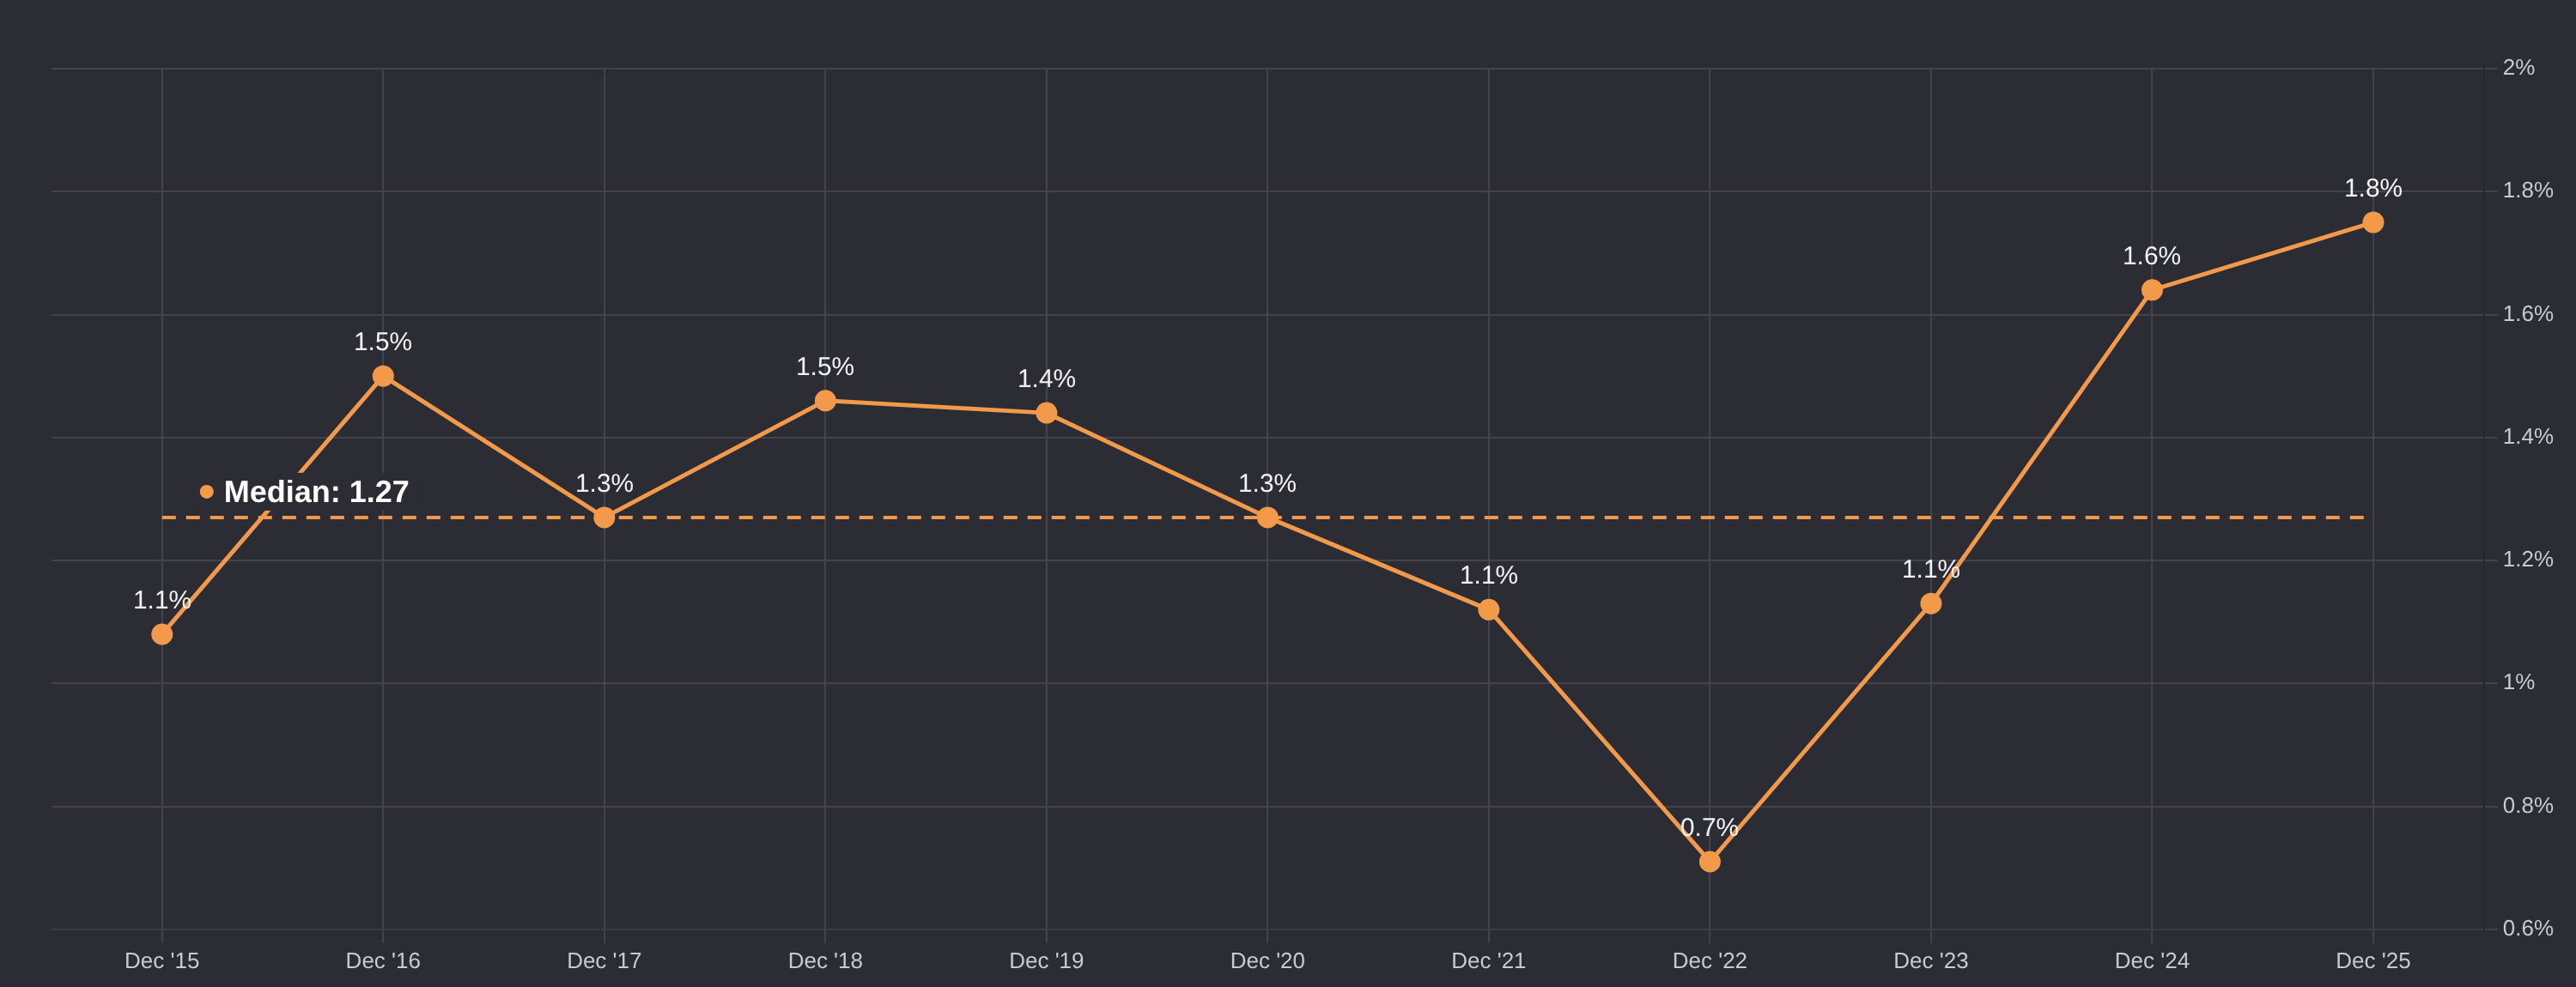
+1.75% | +1.51% | +1.27% | +1.33% |
💡 +1.4% a year (Bad +1.8% · Good +1.0%). Amazon doesn’t buy back shares (none in 2025 or the first nine months of 2026, 10-Q) and dilution has risen from 1.1% in 2023 to 1.75% last year. Base sits between the 3-year (1.51%) and 5-year (1.27%) rates. Bad extends the latest 1.75% trend, and Good eases to 1.0% if grants grow slower than the share price.
Net Profit Margin (Average)
| 1 Year | 3 Years | 5 Years | 10 Years |
|---|---|---|---|---|
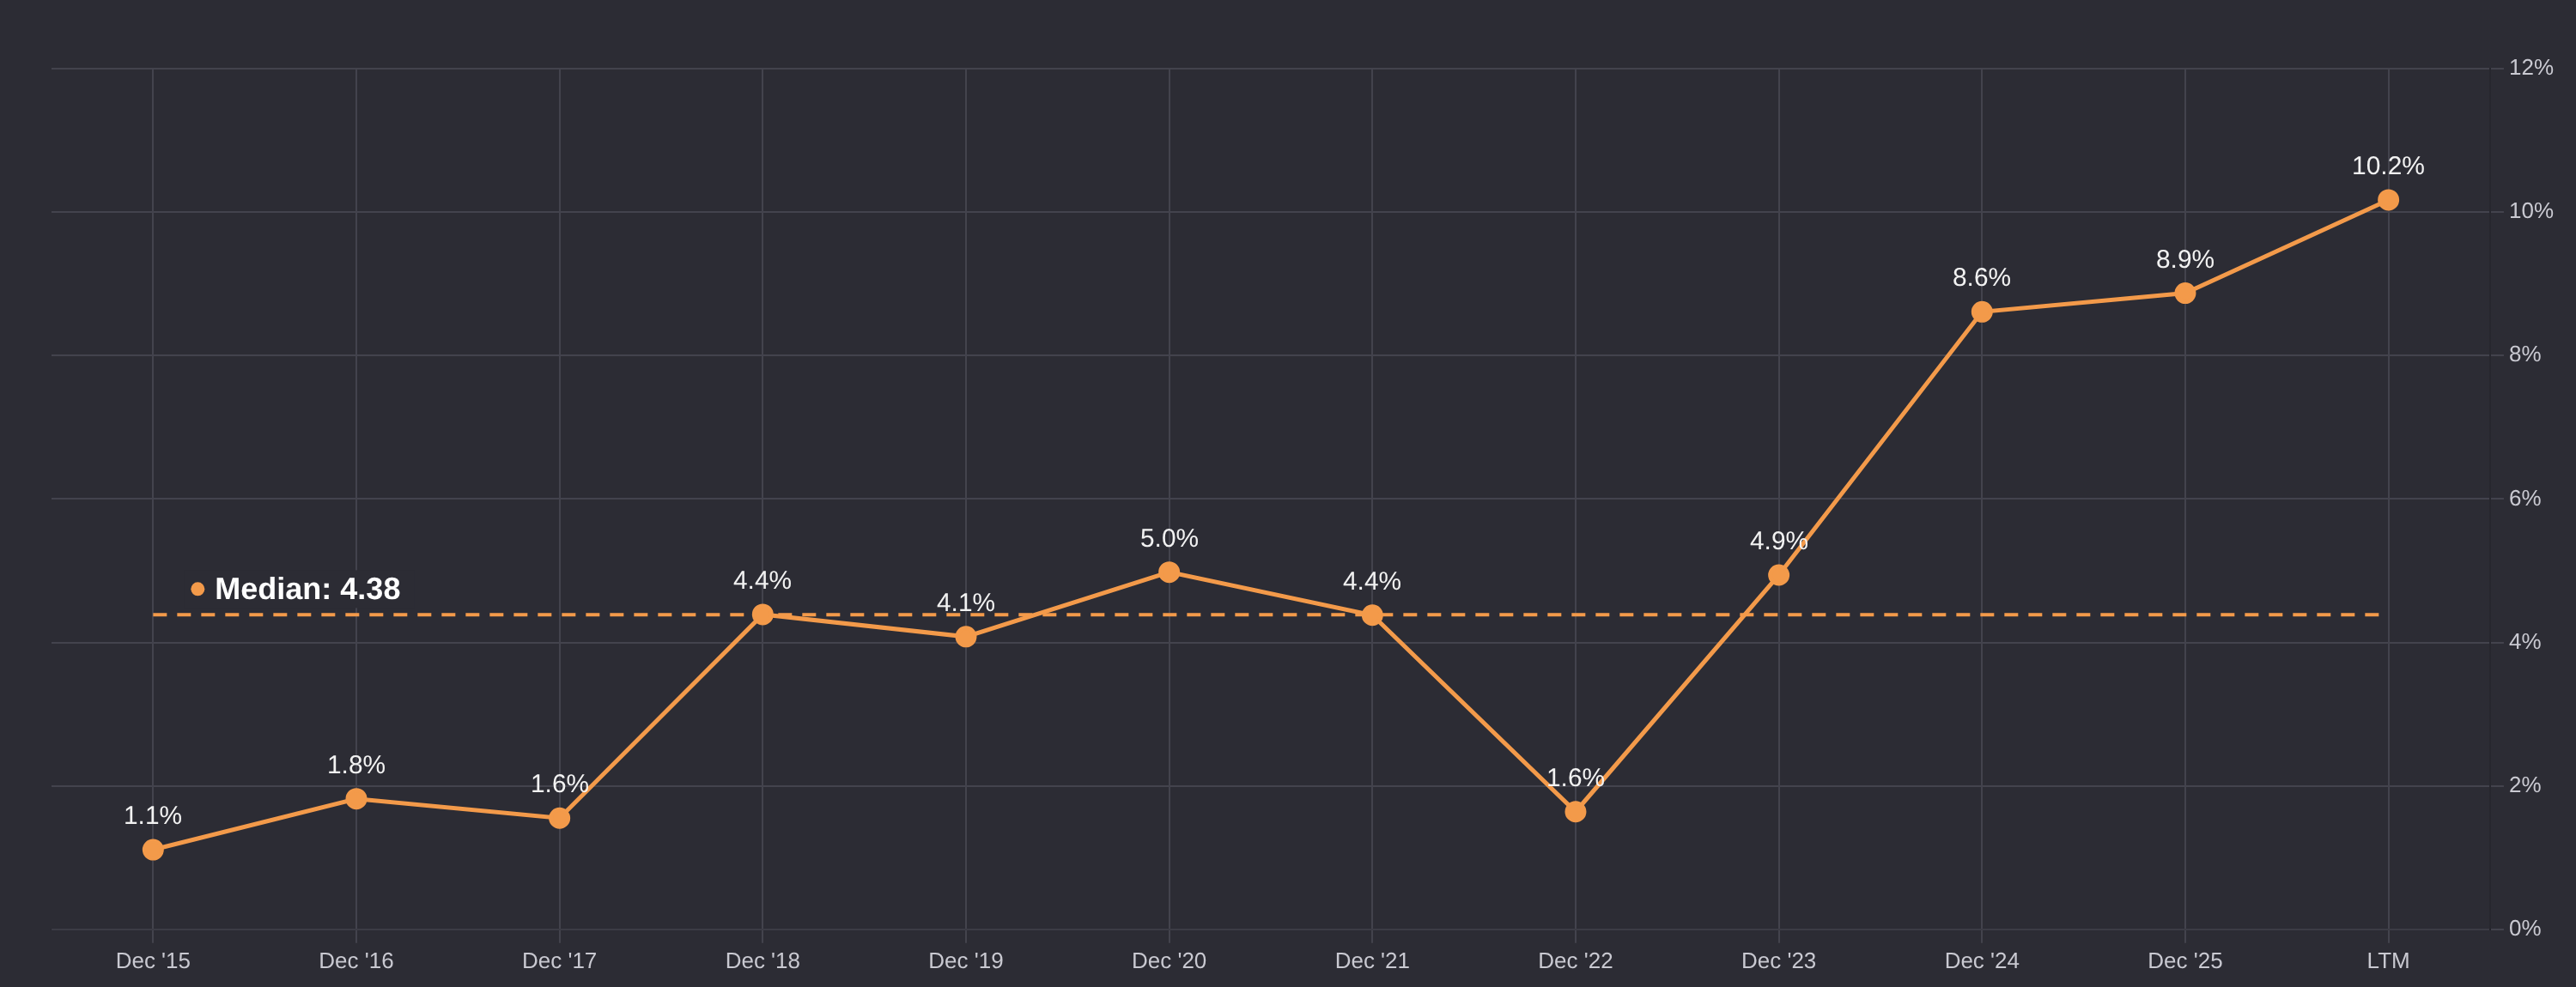
Reported | 10.83% | 8.47% | 6.40% | 4.94% |
Ex. non-operating items | 8.87% | 7.47% | 5.69% | 4.53% |
💡 11.3% in year 5 (Bad 9.5% · Good 13.0%). The core margin is 10.2% TTM (22.5% tax). The DCF margin path is linear, so the year-5 operating margin is about 14.6% in Base (13% + 3.5 × 4/9), which at 22.5% tax gives 11.3%. Bad: 12.2% × (1 − 22.5%) = 9.5%. Good: 16.7% × (1 − 22.5%) = 13.0%.
P/E ratio (Average)
1 Year | 3 Years | 5 Years | 10 Years |
|---|---|---|---|
30.36 | 35.20 | 39.30 | 75.64 |
The table is price over reported EPS. On core EPS, the average P/E is 37.0 over one year and 39.3 over three years, and today’s is 32.0.
💡 27 in year 5 (Bad 21 · Good 32). Base assumes the core P/E falls from 32 to 27 as growth slows, a de-rating of about 15% and well below the 37–39 recent averages on core EPS. Bad is a de-rating to a mature level. Good is a modest premium for sustained growth. The 5- and 10-year averages are inflated by earlier thin-profit years, so I don’t use them.
Scenarios (5 years)
| Bad | Base | Good |
|---|---|---|---|
Revenue growth (CAGR) | 9.4% | 14.2% | 17.1% |
Net profit margin | 9.5% | 11.3% | 13.0% |
Shares outstanding (CAGR) | +1.8% | +1.4% | +1.0% |
P/E | 21 | 27 | 32 |
EPS in year 5 | $9.96 | $14.98 | $19.92 |
EPS CAGR | 6.01% | 15.02% | 21.77% |
The Base scenario, discounted at the 9.80% cost of capital:
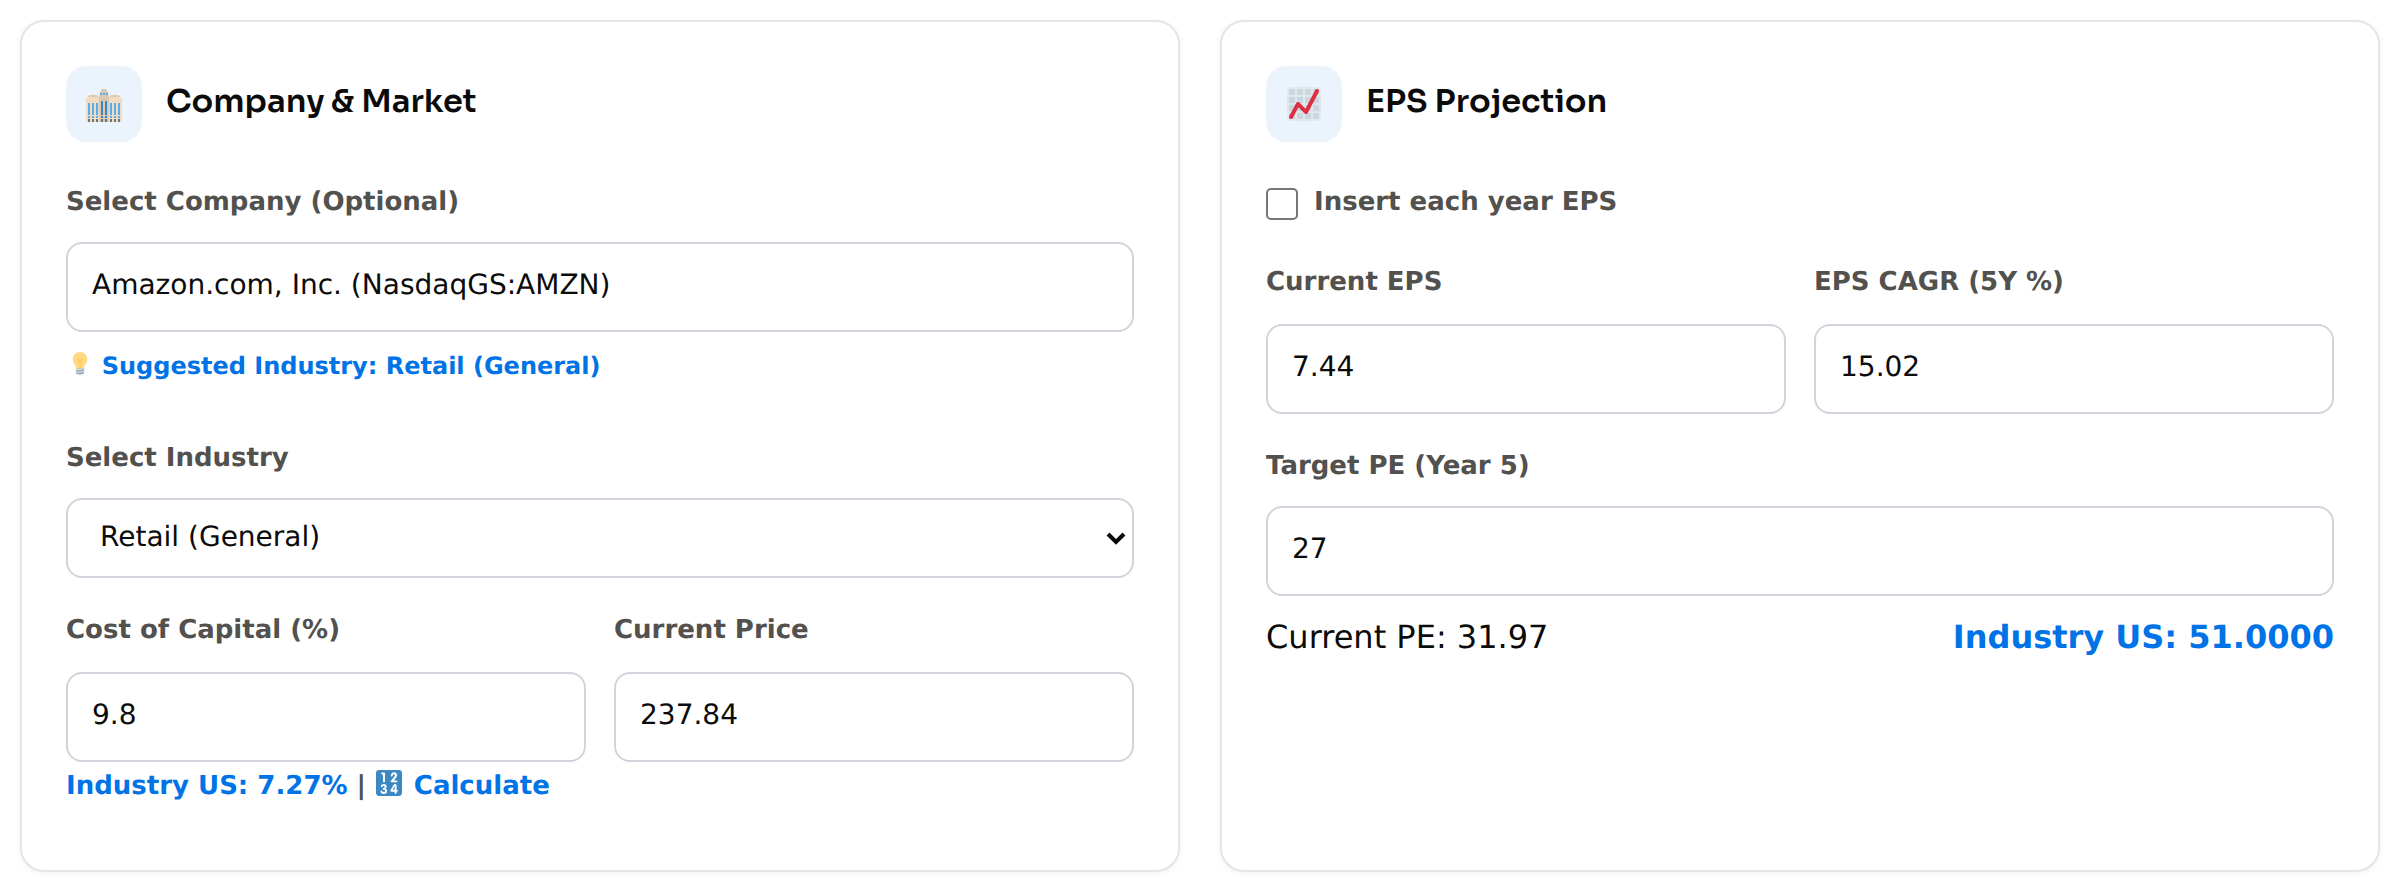
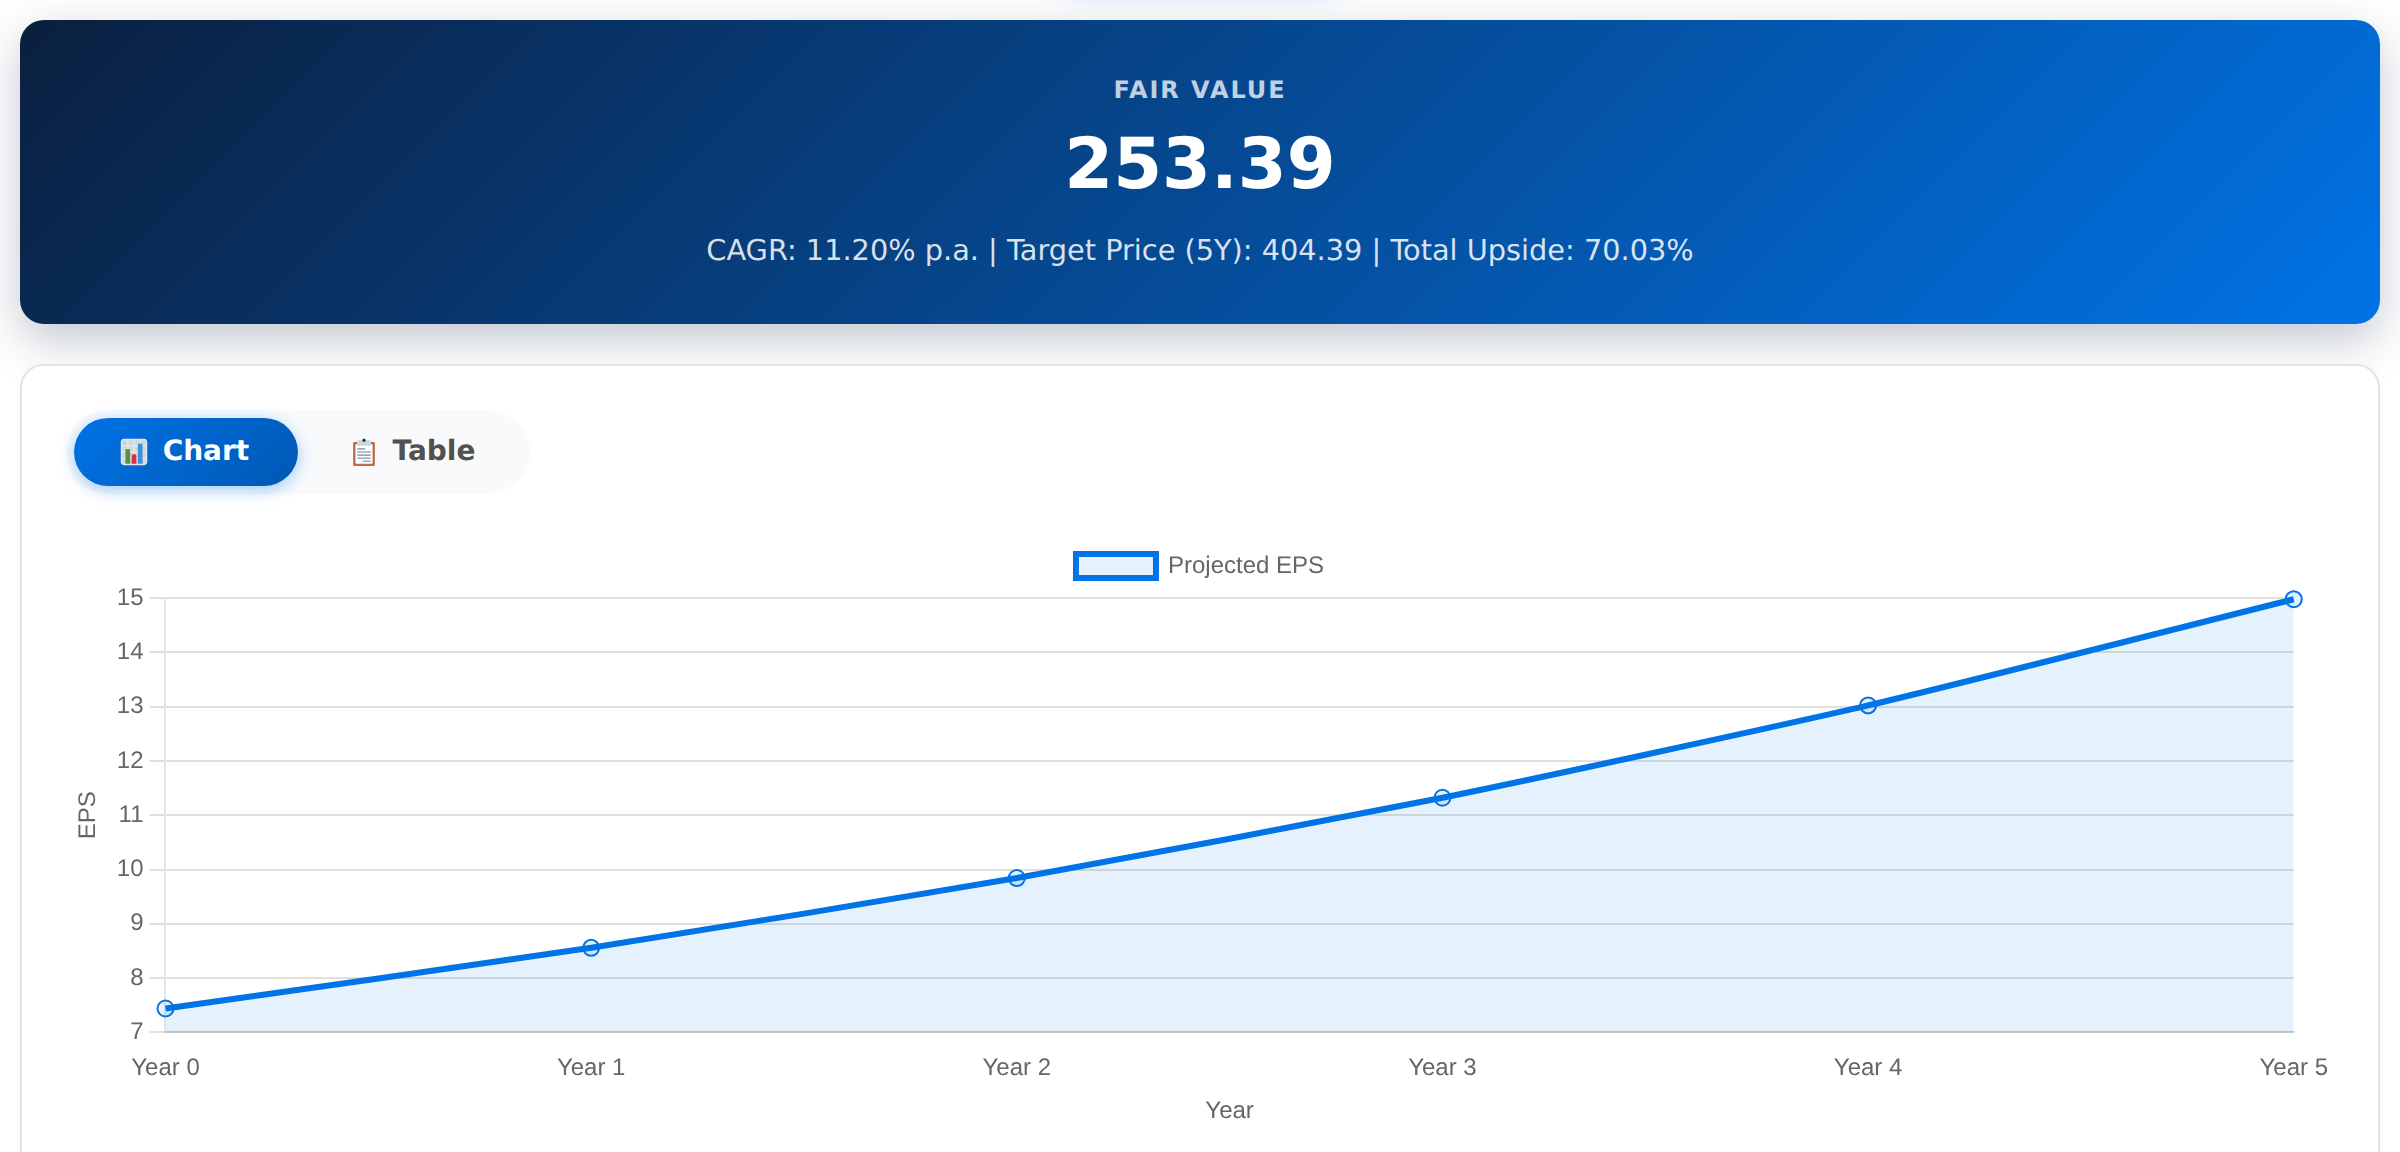
EPS Growth fair value: $253.39.
Monte Carlo between the Bad and Good scenarios:
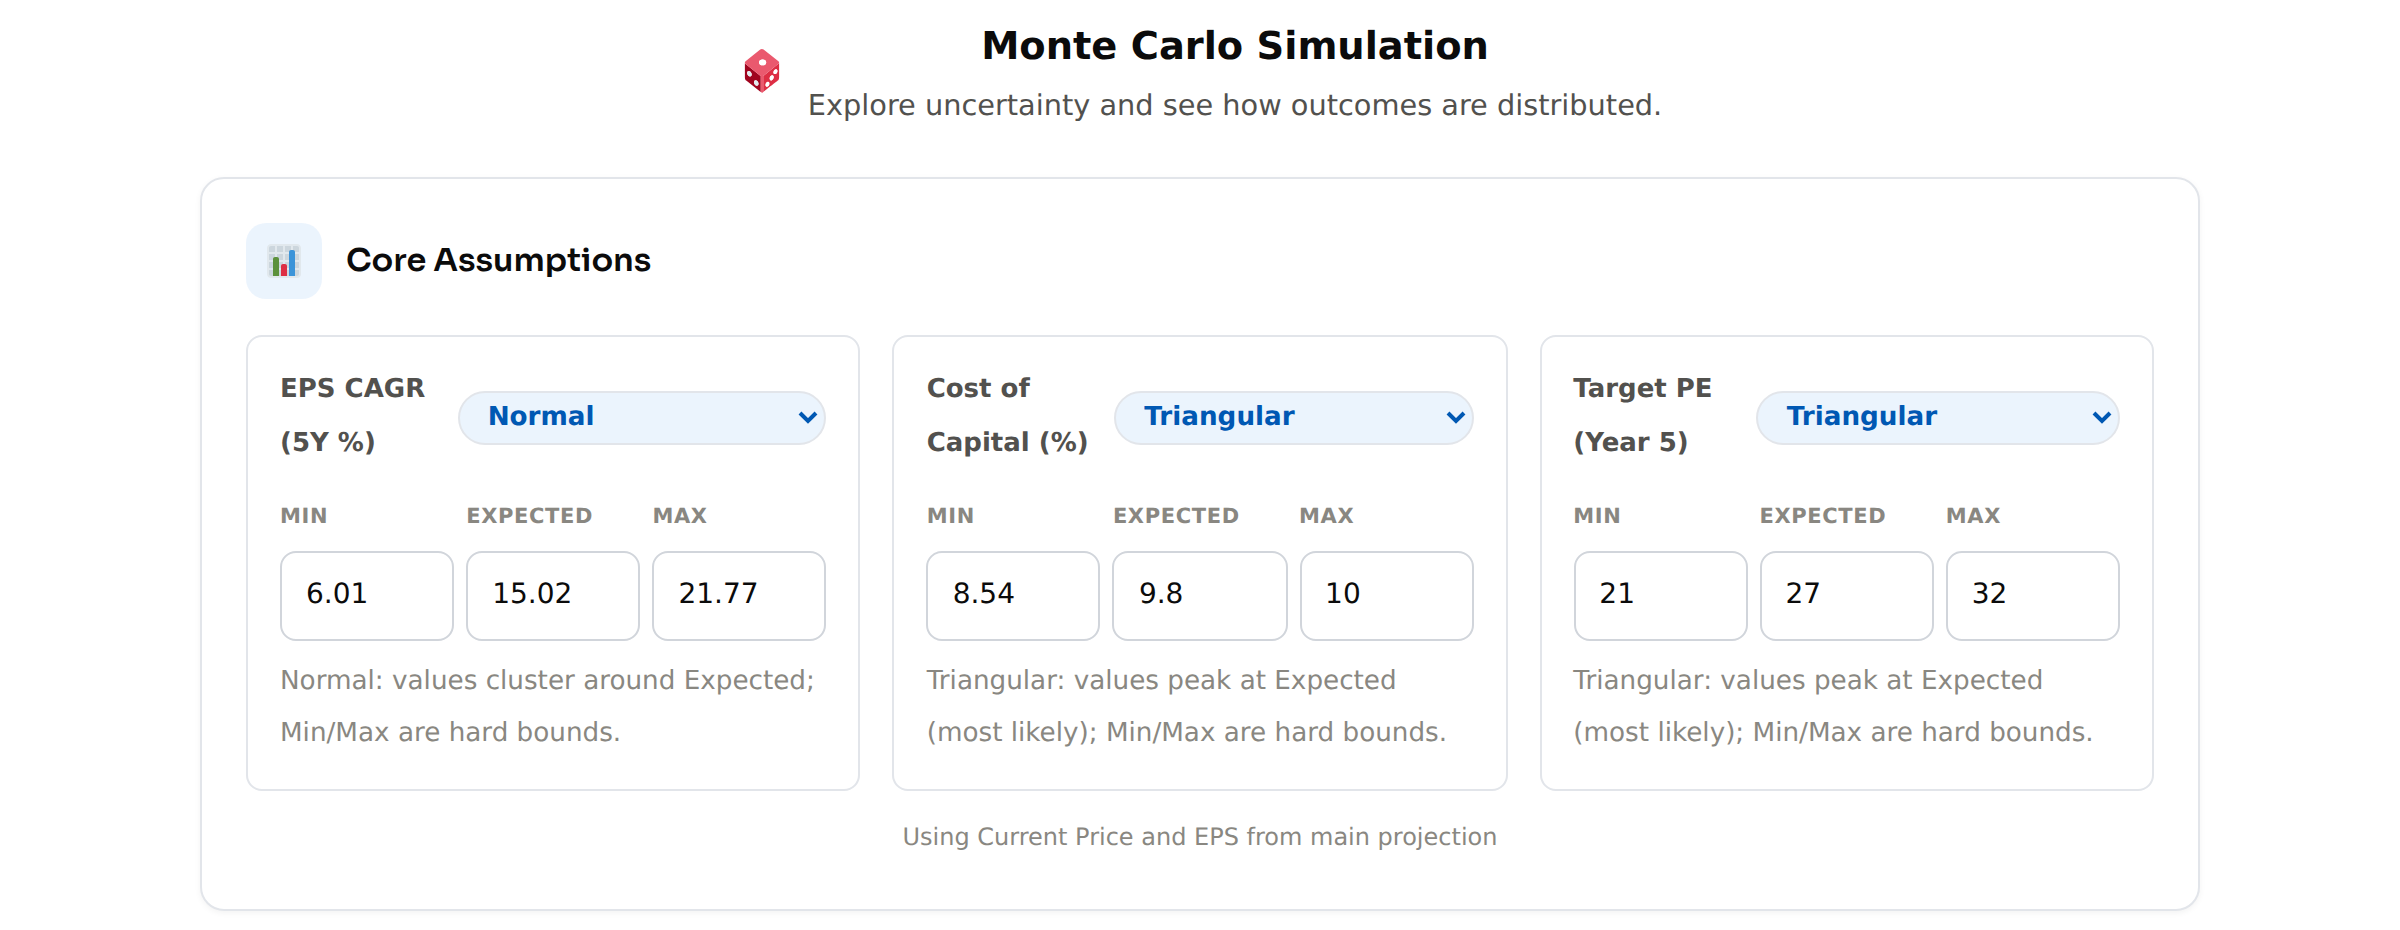
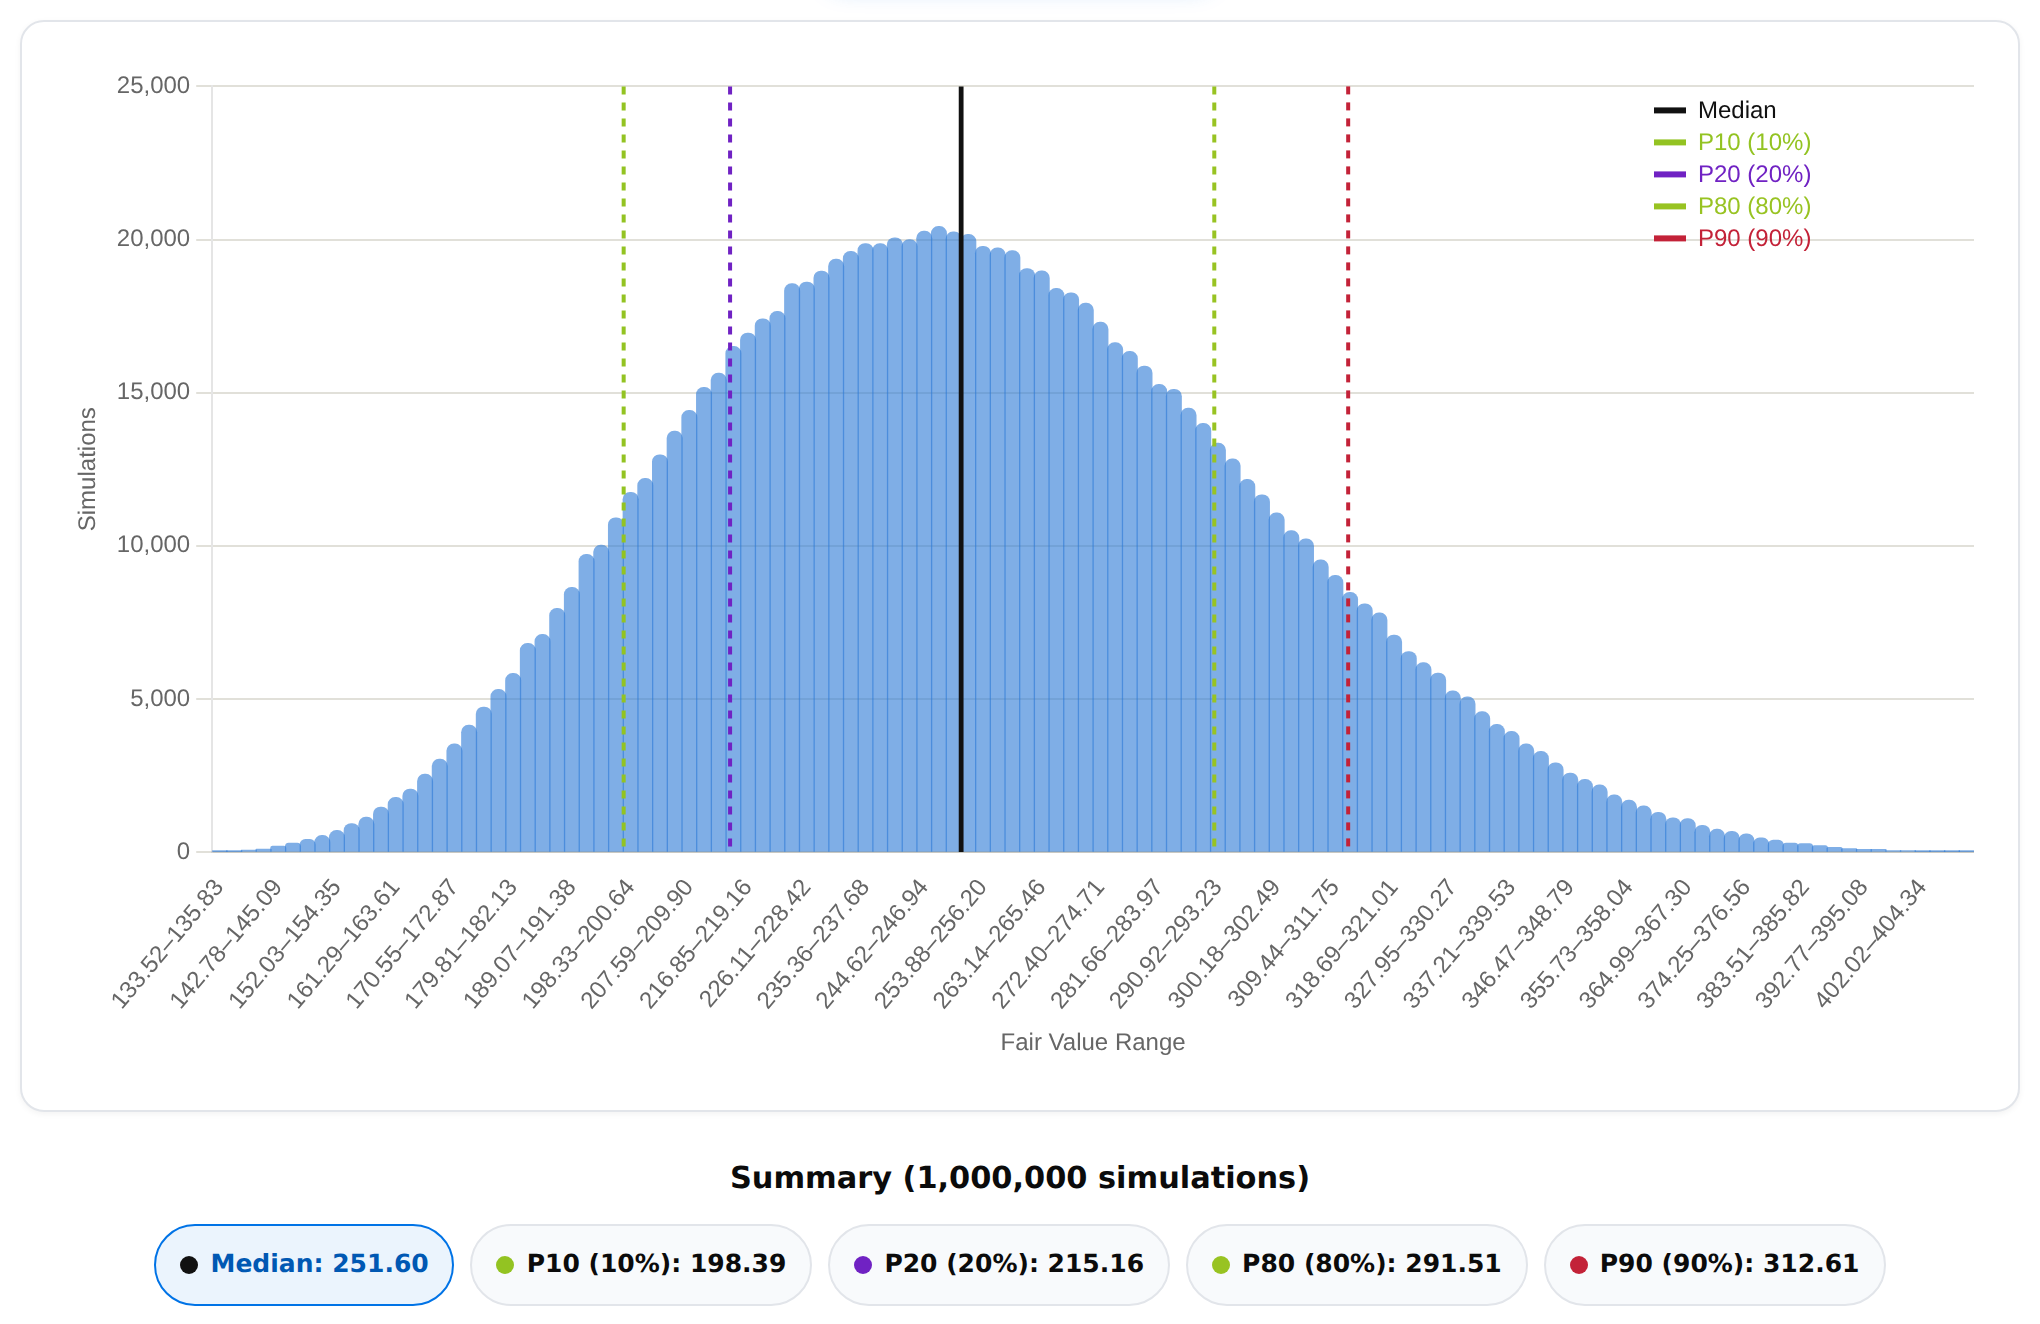
At $237.84, the price is between P20 ($215.16) and the median ($251.60): Amazon looks fairly valued on this method (about 60–70% of simulations give a higher value).
Try it yourself: https://thefairvaluejournal.com/eps-growth-projection/
EPS Scenario Returns
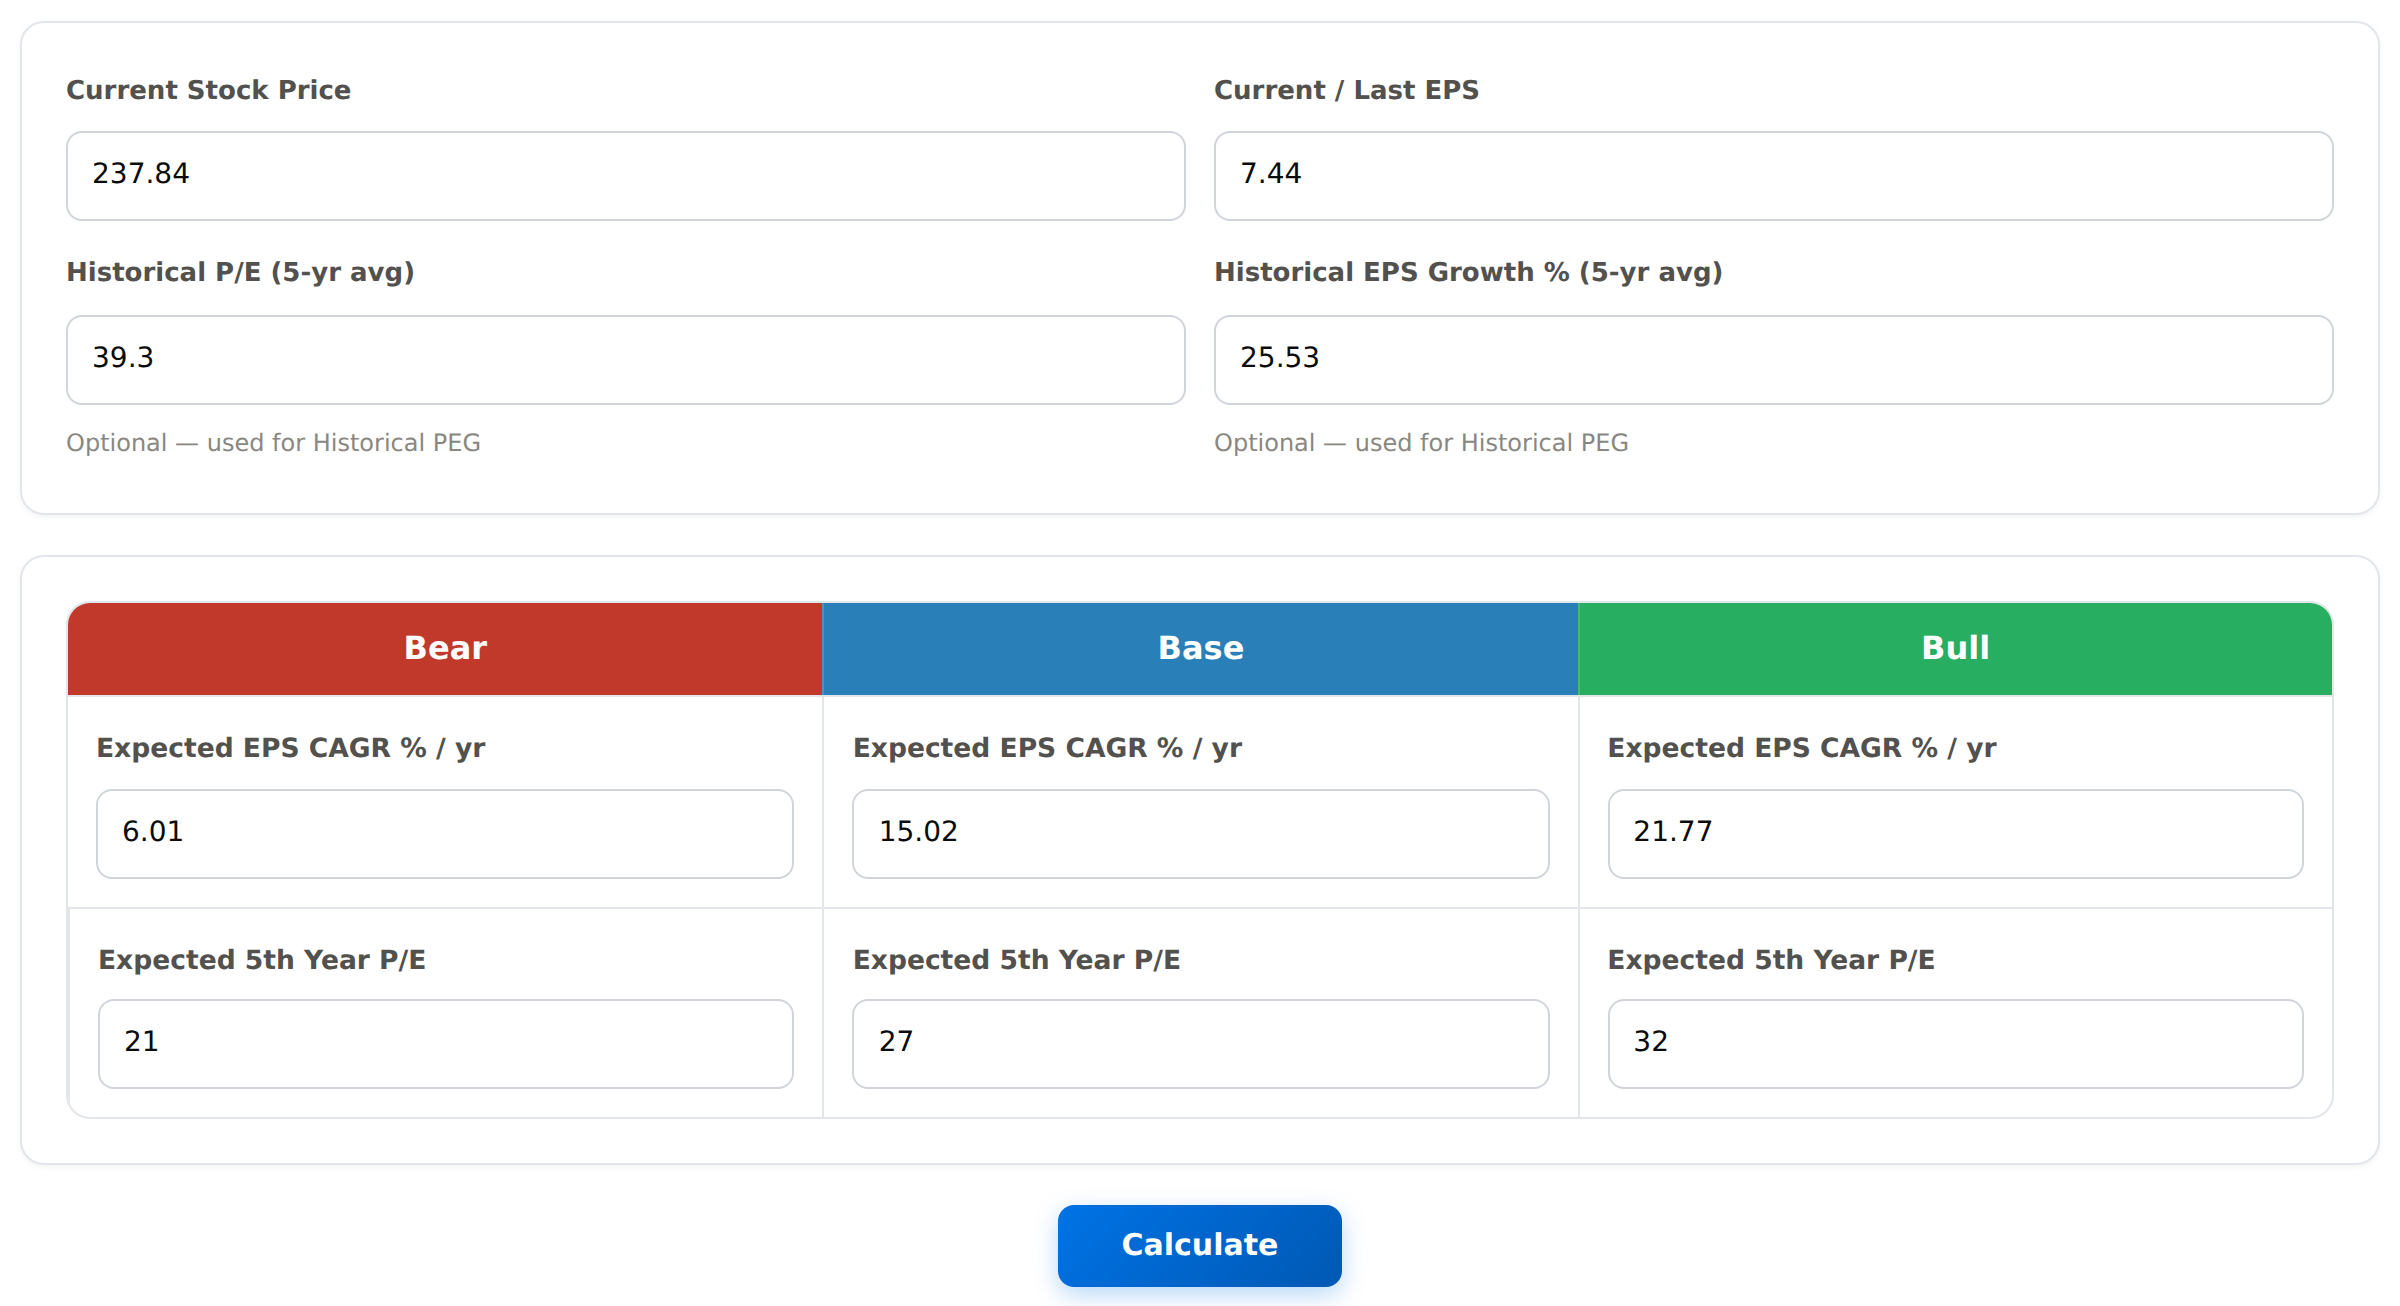
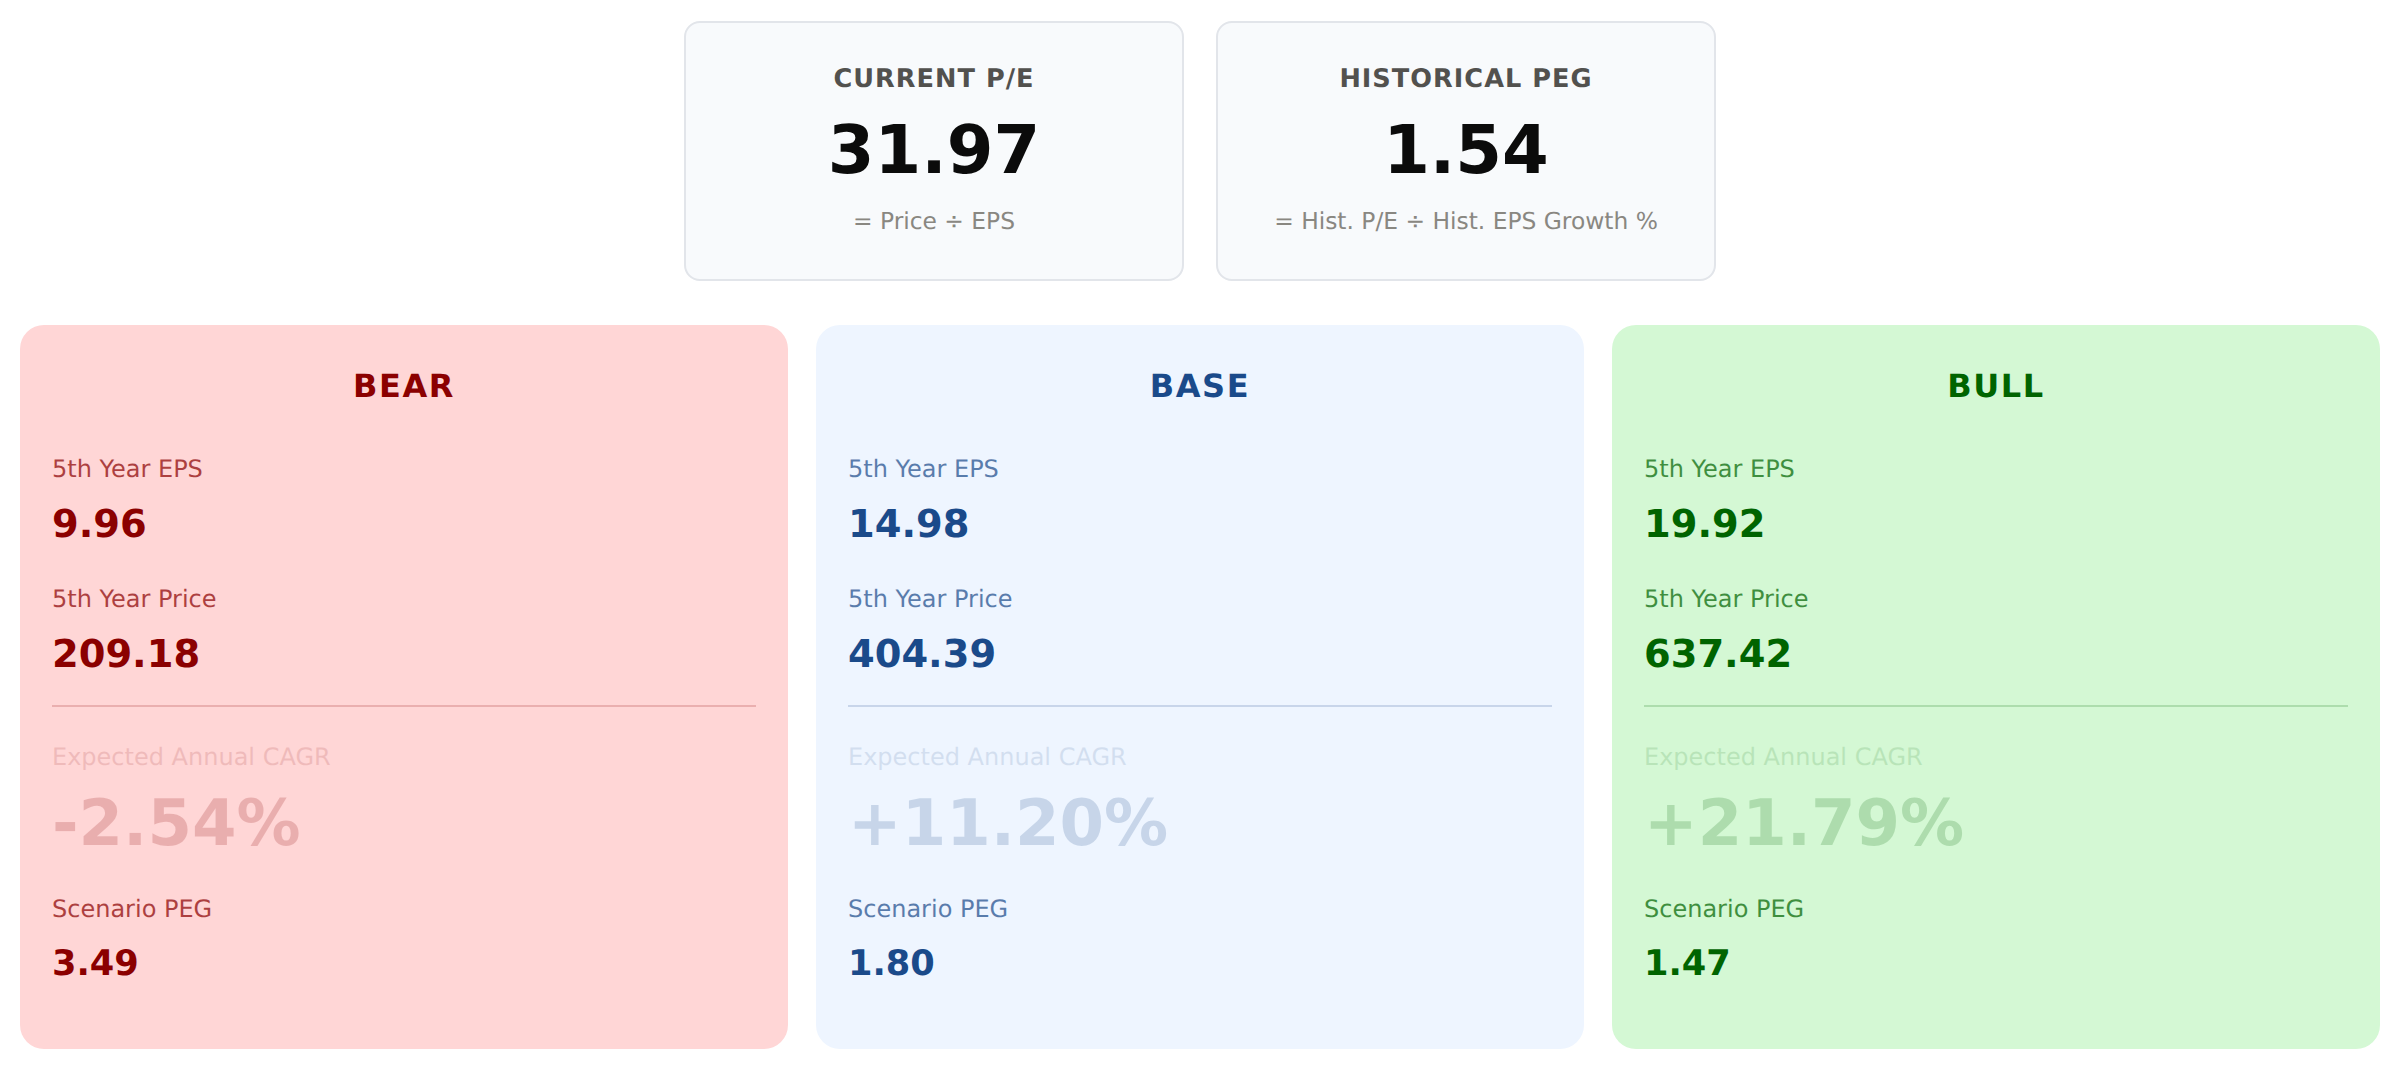
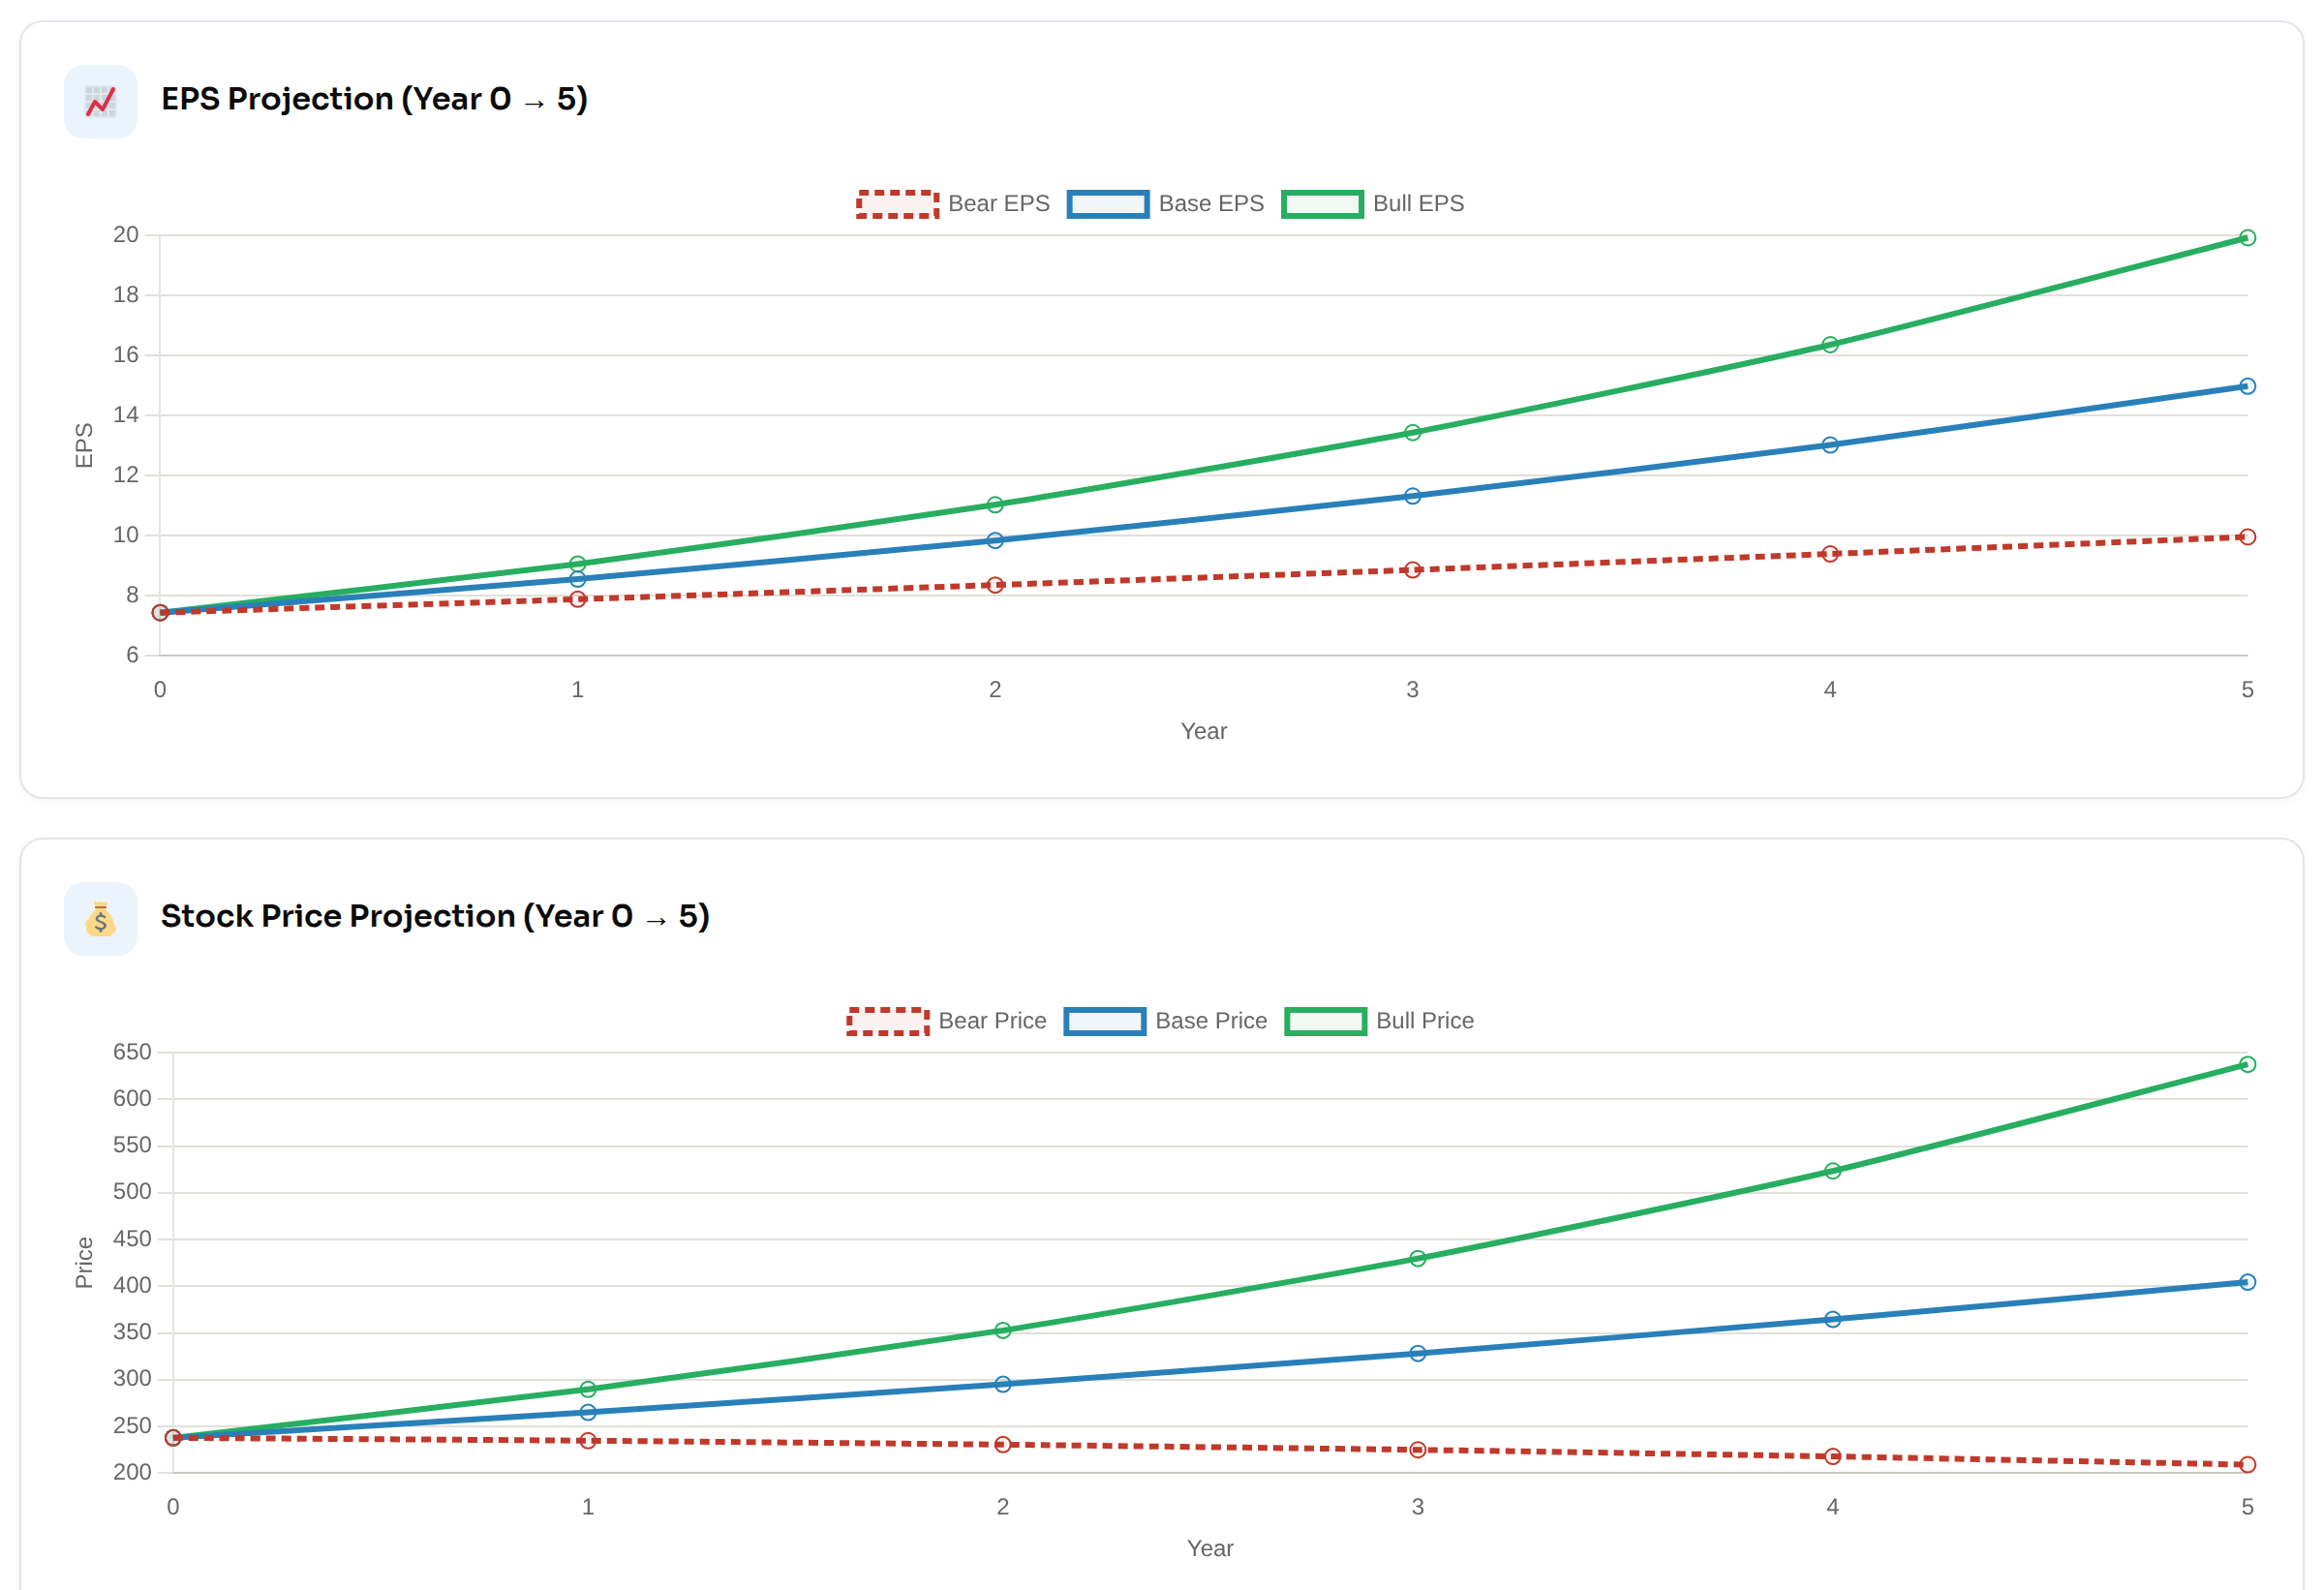
From $237.84, Base returns 11.20% a year, above the 9.80% cost of capital. Good returns 21.79%, and Bad loses 2.54% a year.
Try it yourself: https://thefairvaluejournal.com/eps-scenario-returns/
✍️Summary
Each method enters with its weight. Monte Carlo methods use their P10/P20 (buy) and P80/P90 (sell) values; historical methods use 20%/10% below and above their fair value.
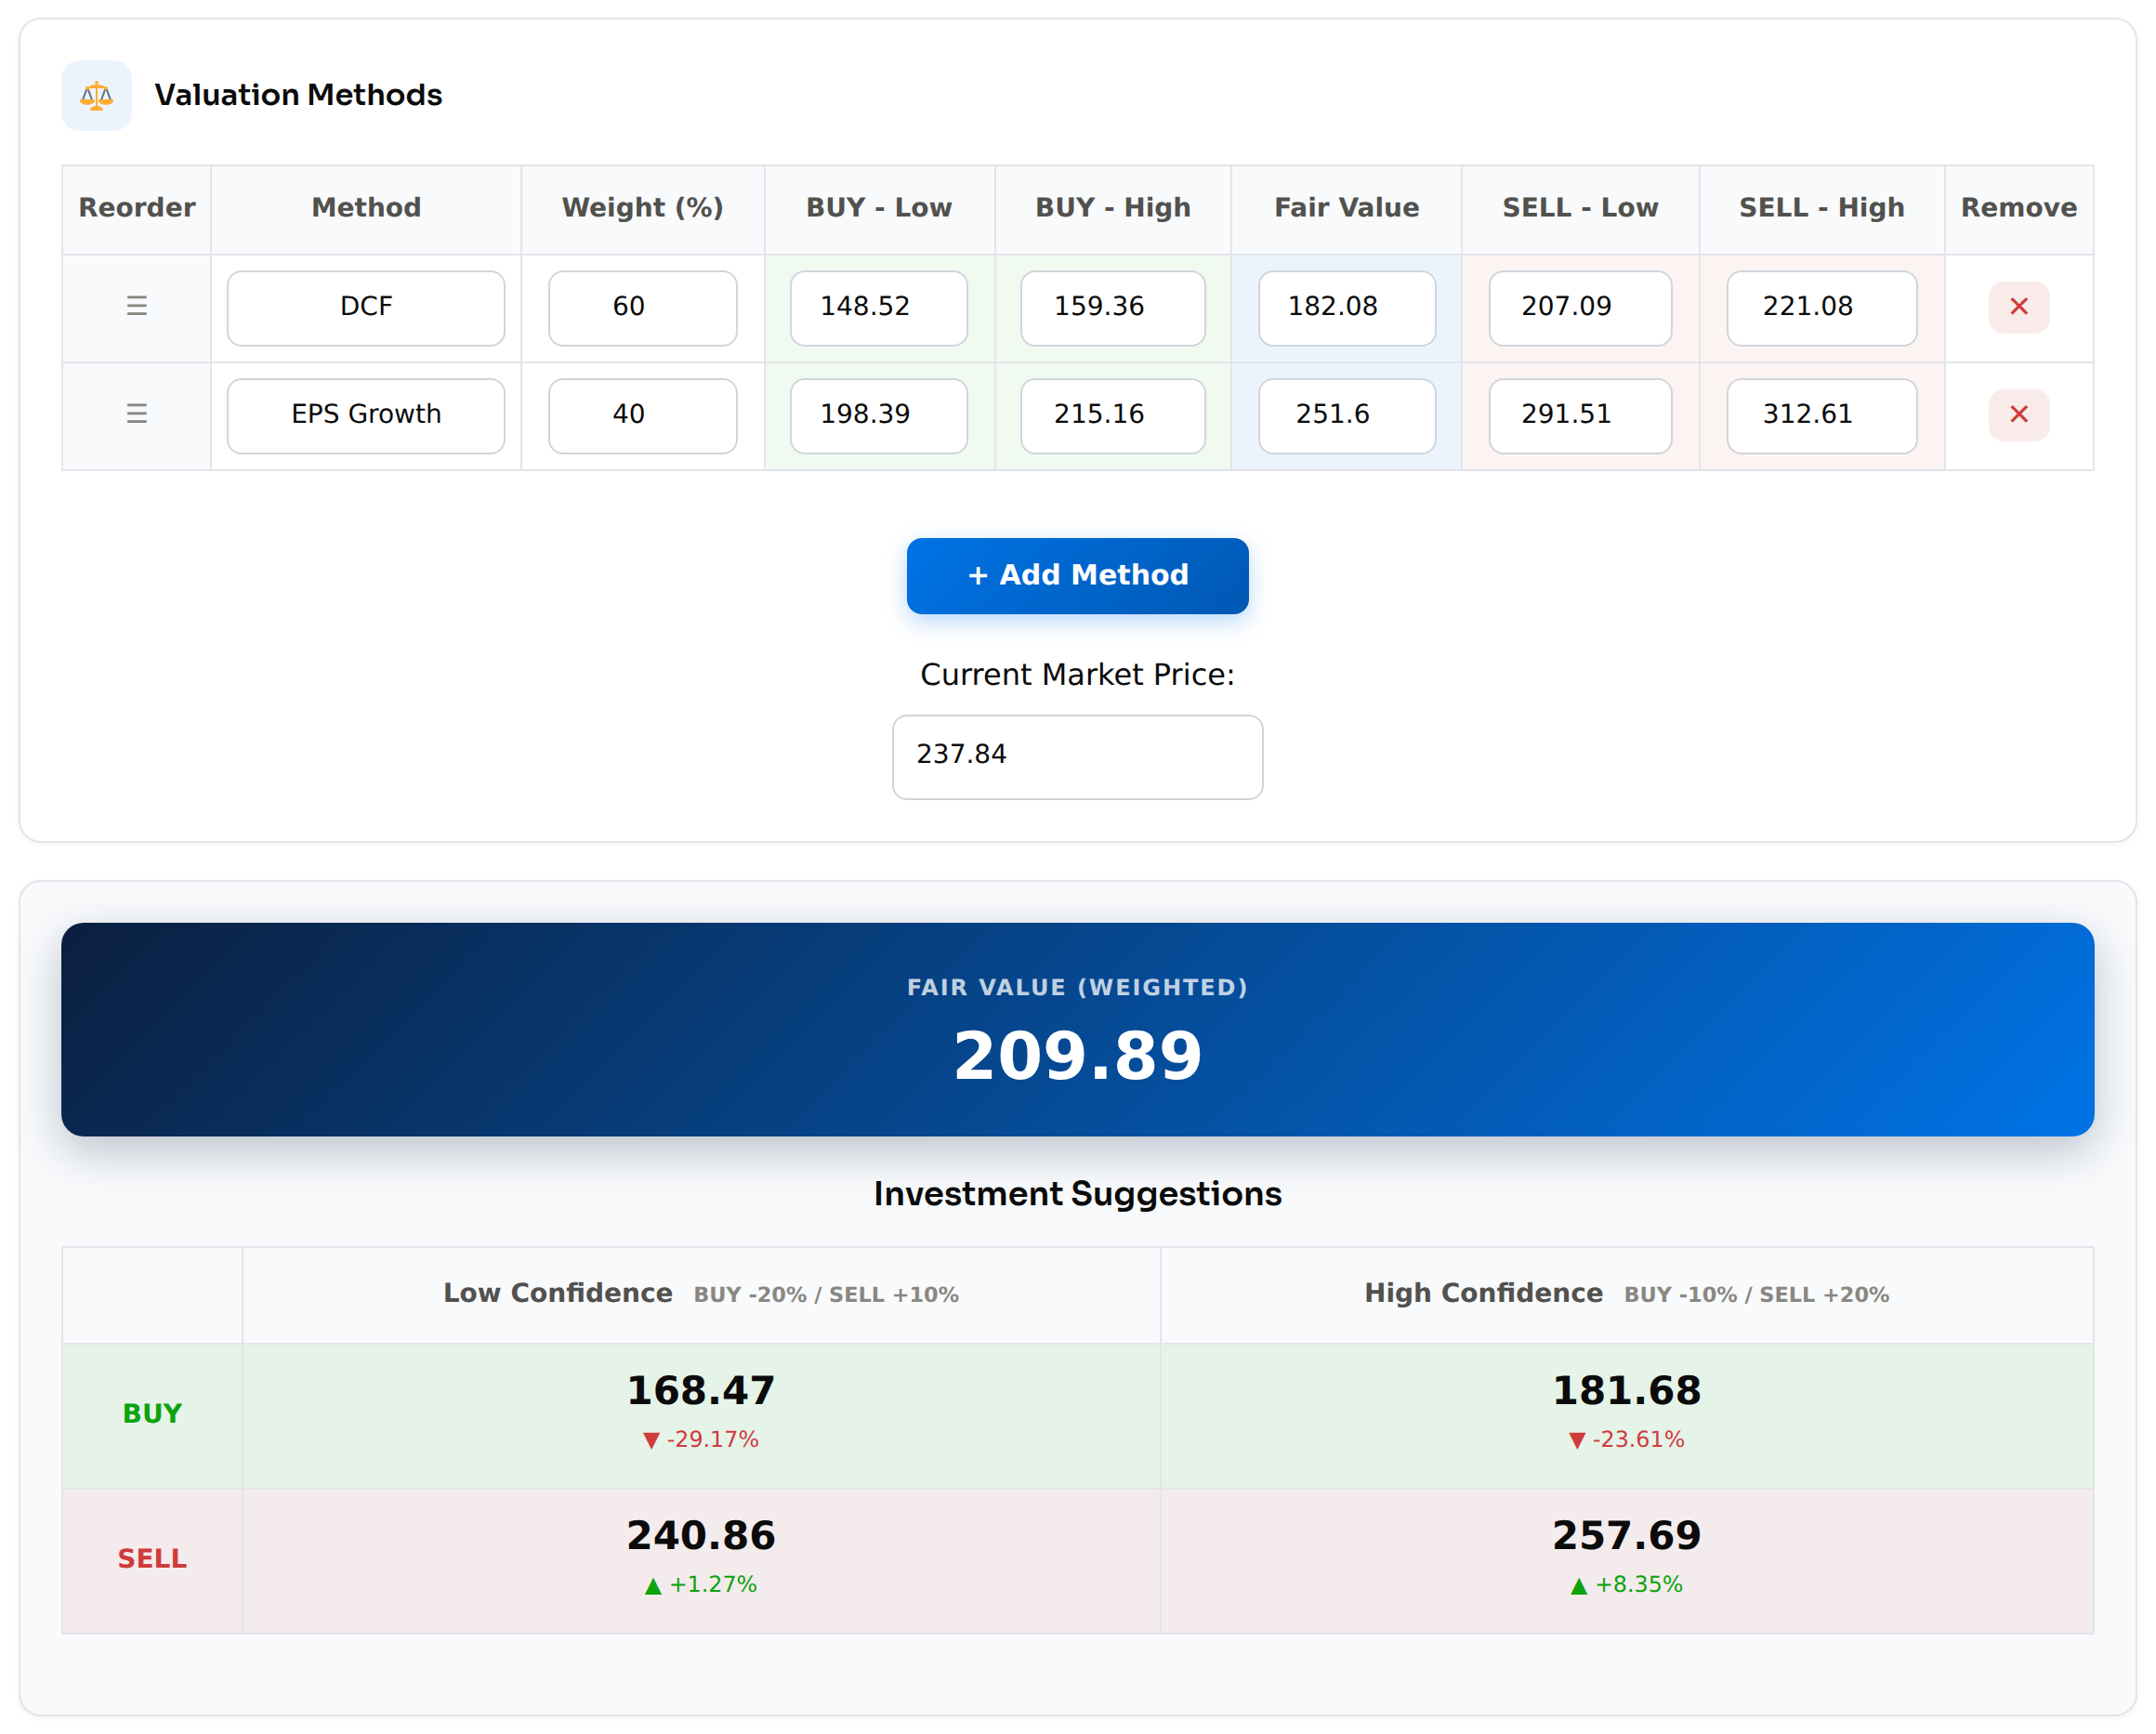
I would probably buy or add below $181.68 (the high-confidence buy level) or even closer to its fair value, given the high moat and the capability of this business to expand into any other segments and win it.
A fair value is always wrong to some degree, decimals included 😮
At $237.84, Amazon looks overvalued.
Fair Value: 209.89 dollars.