
🍔🍟Business Overview
🎯Key Metrics
Total: 8.5/17
+2 ✅✅ Projected Operating Margin: 50.00%
+0 ⚠️ Projected 5-Year Revenue CAGR: 3.60%
+1 ✅ Last 5-Year ROIC: 18.53%
+1 ✅ Estimated Cost of Capital: 8.52% (less than ROIC)
+1 ✅ Last 5-Year Shares Outstanding CAGR: -0.95%
-1 ❌ Projected 5-Year EPS CAGR: 5.39% (given the ease of manipulating earnings metrics, sub-10% growth warrants caution)
+0 ⚠️ Projected 5-Year Dividend CAGR: 6.00%
+0.5 ✅ Moody’s Rating: Baa1
+2 ✅✅ Morningstar Moat: Wide
+2 ✅✅ Morningstar Uncertainty: Low
McDonald’s is one of the most recognized restaurant brands in the world. Its delicious products and efficient operations is a staple and an example to all restaurant and dining businesses.
I’m also projecting that this company will be one of the best to take AI into its operations, expanding margins and reducing reinvestment and operation expenses, resulting in a higher operating margin, Return On Invested Capital (ROIC) and Sales/Capital ratio.
However, the weakness of the economy and consumer spending will put pressure in revenue growth during the next couple of years, coupling with the fact that a more health aware customer (resulting, or not, from new obesity drugs) will probably opt for other choices.
So, in resume, I forecast that McDonald’s will expand its margins through an increase in efficiency of its operations (probably with the aid of AI) but will also see its revenue growth slow down, probably below the economy growth rate given the maturity of the business and the decrease of consumer spending.
Please note these are only my assumptions, taking into account the current state of the business and my own thoughts on the world, economy and the company. Each of these will be explained in more detail below.
As a little disclaimer, I will add that I normally use these key metrics to help me allocate capital over my investment portfolio, however take everything on this valuation post with a grain of salt. I will guide you though all my thought processes but will also provide you with all the tools to override/change everything so you can come up with your own value for the company. As with anything, take responsability for your own investment decisions.
📈Business Valuation
Before presenting you with a final and raw number, I will show you first my own assumptions, as well as the data that led to that. My final objective here is to write down my valuation thoughts (ramblings?) and hopefully, in the process, learn and help you learn something new.
Revenue Growth
Below is the last ~10 years of revenue growth for McDonald’s:
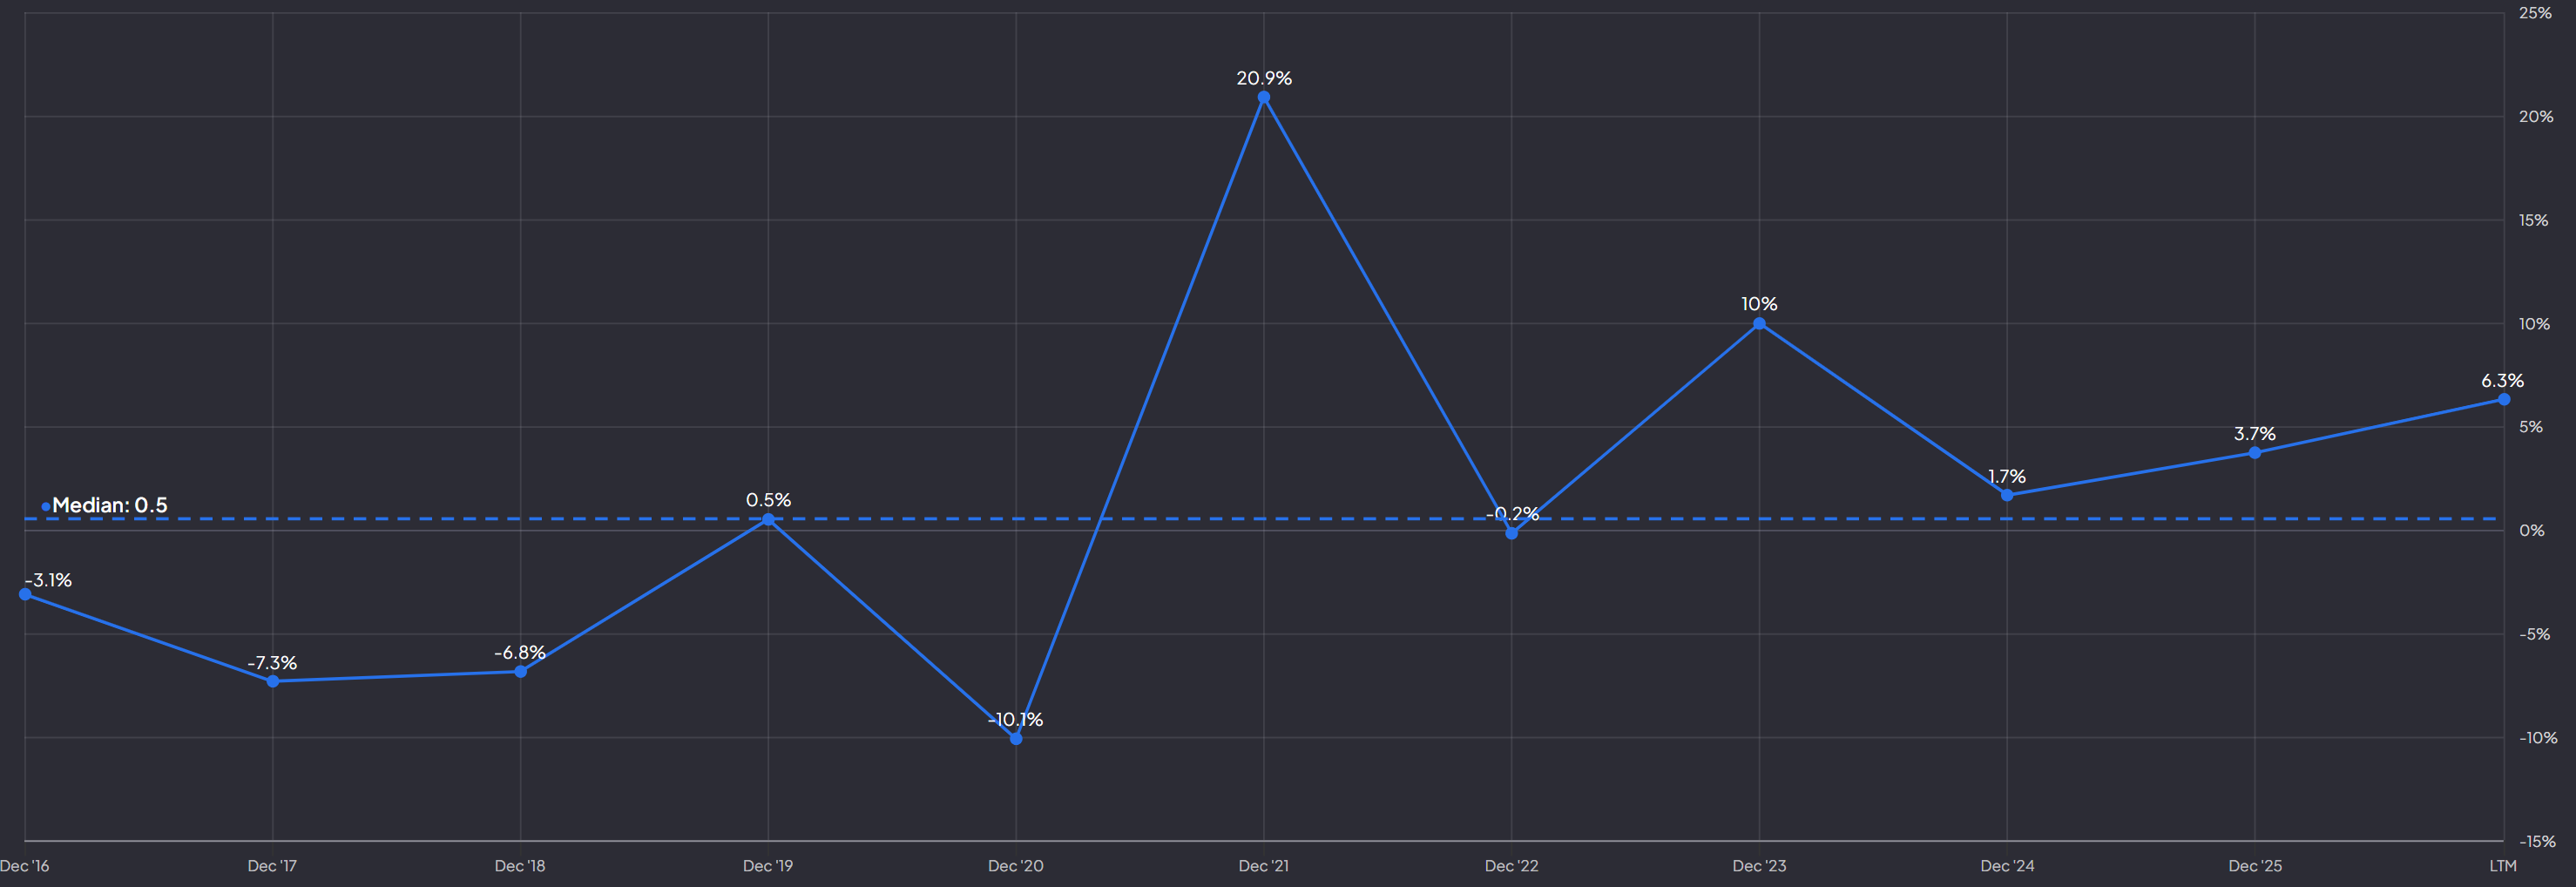
💡Given the maturity of the business, its historical data and my assumption that during the next couple of years there will be more weakness in the consumer spending resulting from different health choices but also from economy factors, I see the company growing its revenues ~3-5% during the next couple of years.
Cost of Capital
I’ve used the latest quarterly and annual report of the company, the 10-Year US bonds as the risk free rate and revenue geographic exposure to come up with its cost of capital, cost of debt and cost of equity. Also, given the fact that Moody’s provided a rating for the company I used it as the debt rating.
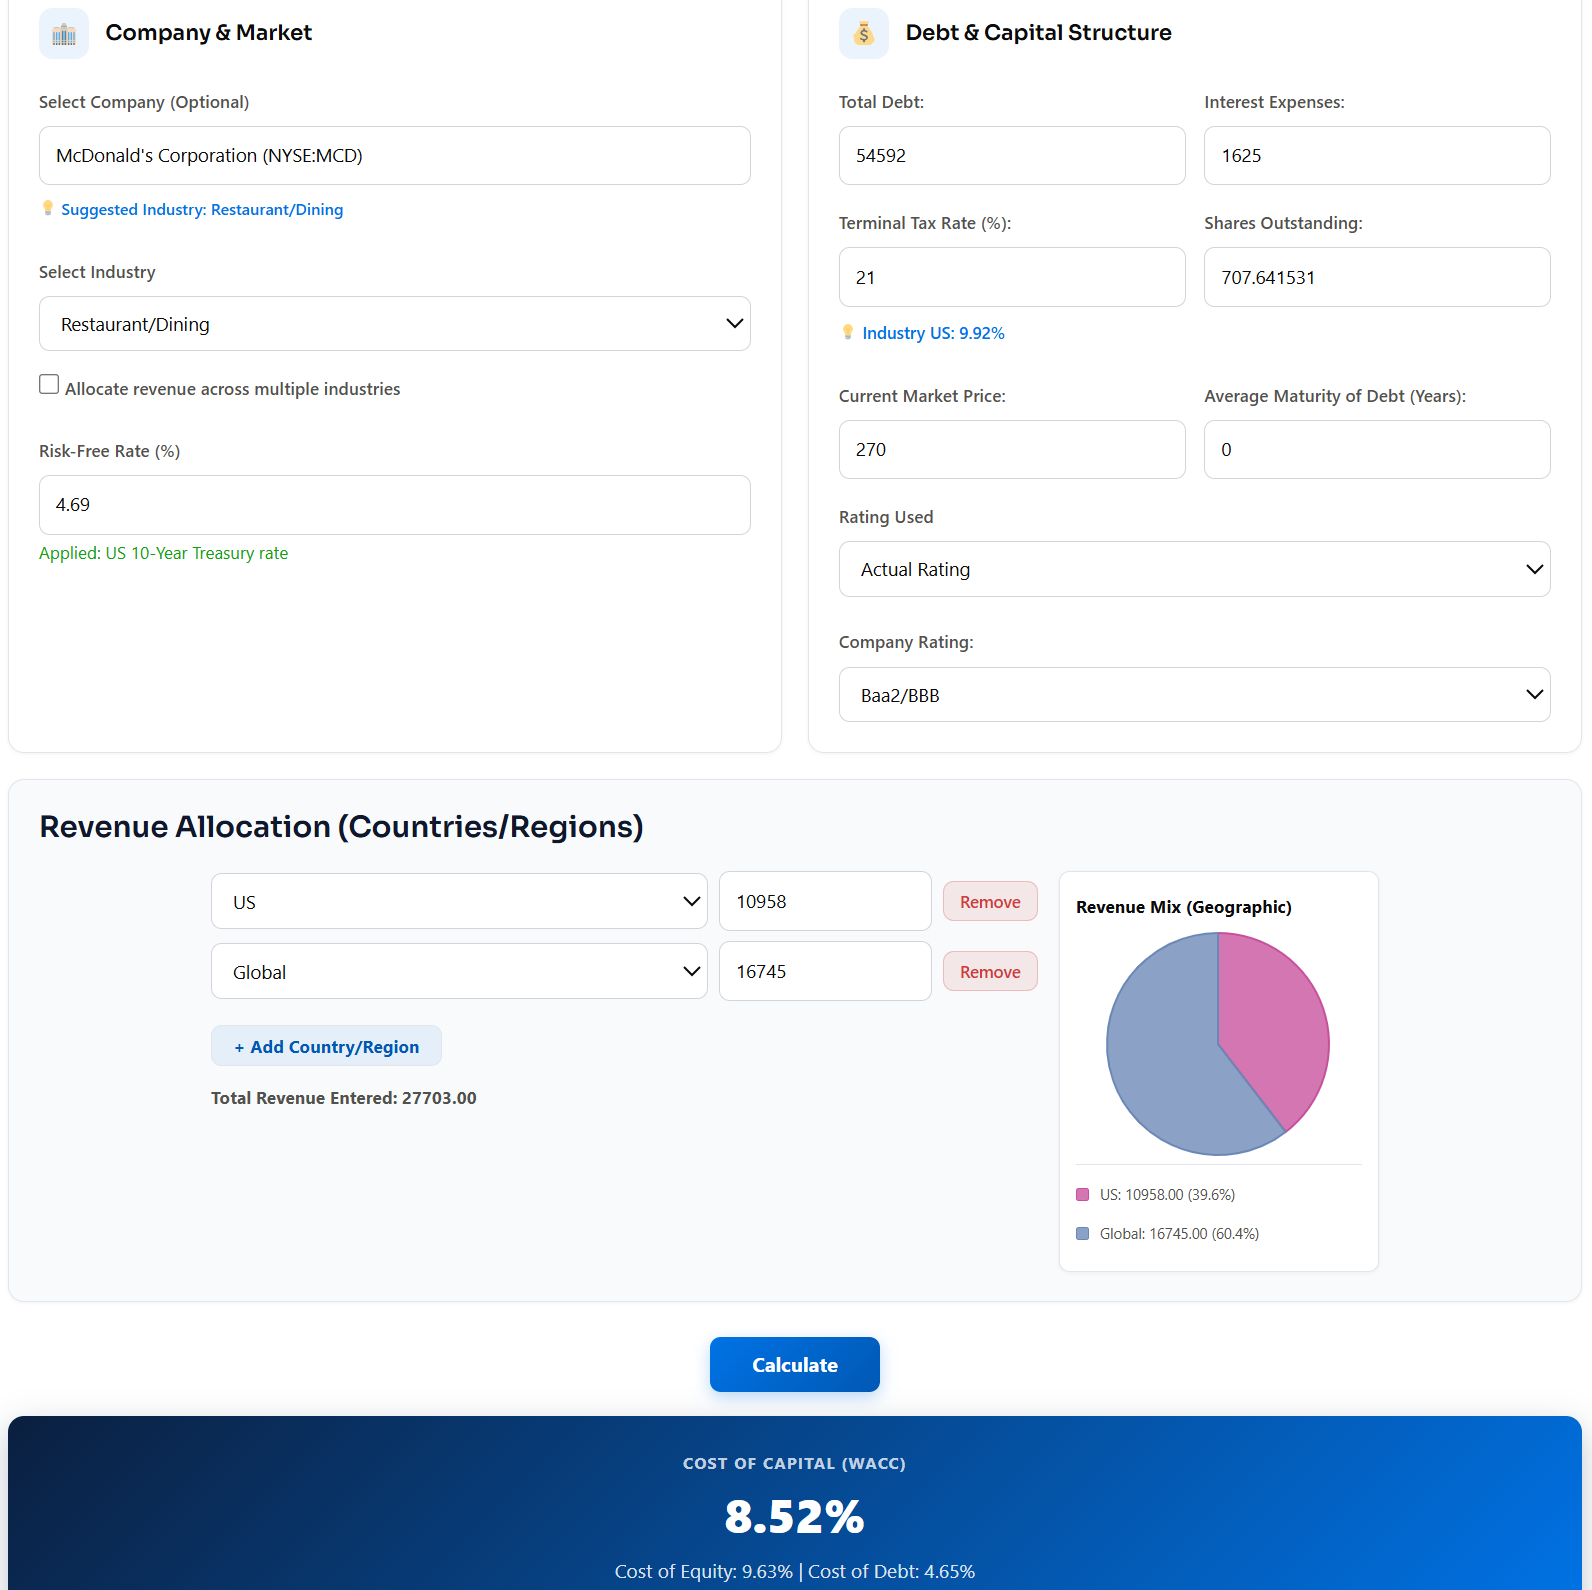
Cost of Capital: 8.52%
This value will be used later as a discount rate in the valuation methods.
Please feel free to come up with your own values by using the tool I’ve used: Cost of Capital – The Fair Value Journal. It is and will ever be completely free 🙂
Also, keep in mind that the average cost of capital in the US for a company similar to McDonald’s in the Restaurant/Dining industry is ~7.16%.
💡My assumption for the cost of capital is that it would remain at the current values ~8.52% given the maturity of the business.
Later, we will explore some variability over these values by using the Monte Carlo simulations, exploring for example if McDonald’s converges its cost of capital to industry values or even if it has a higher cost of capital.
Operating Margin
The graph below also shows the company’s overall operating margin over time:
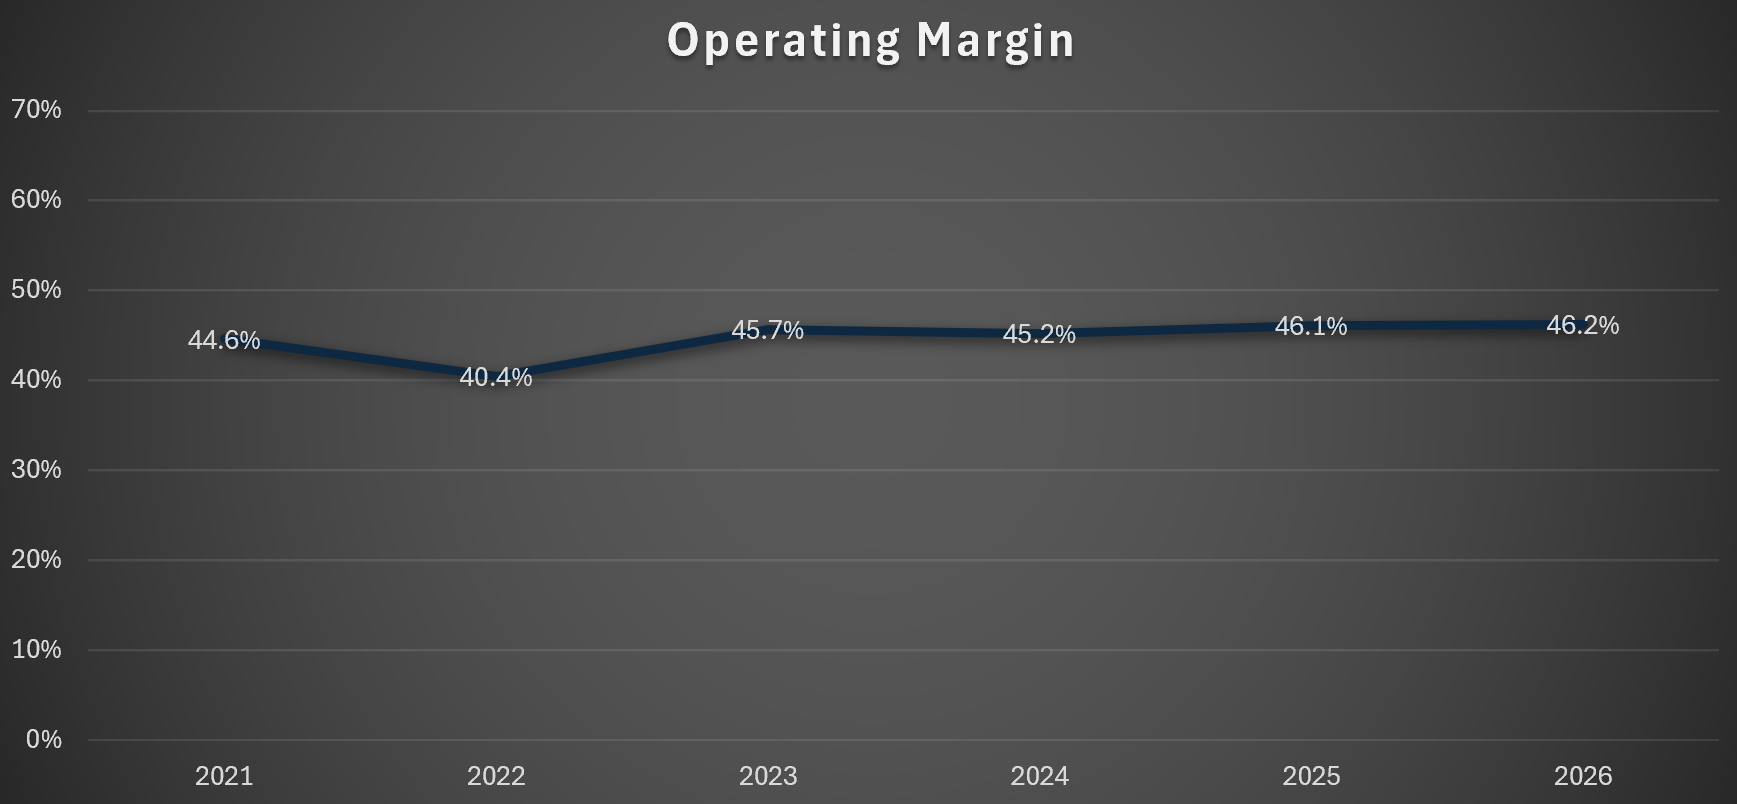
The operating margin has been very stable over the last couple of years. However, I can see a slight margin expansion of ~1-2%.
💡My assumption is that the operating margins will expand gradually to ~50% over the next 5-10 years. This will be caused my the introduction of AI into its business operations, reducing operation expenses and increasing efficiency.
Sales / Capital ratio (Reinvestment)
This ratio (Revenues / [Total Equity + Total Debt – Cash] ) shows you how the capital invested in the business is being translated into its sales/revenues. Please remember that sometimes the company may invest today to only reap the benefits and sales after a couple of years.
Below you can see the last 5 years of Sales to Capital ratio for McDonald’s:
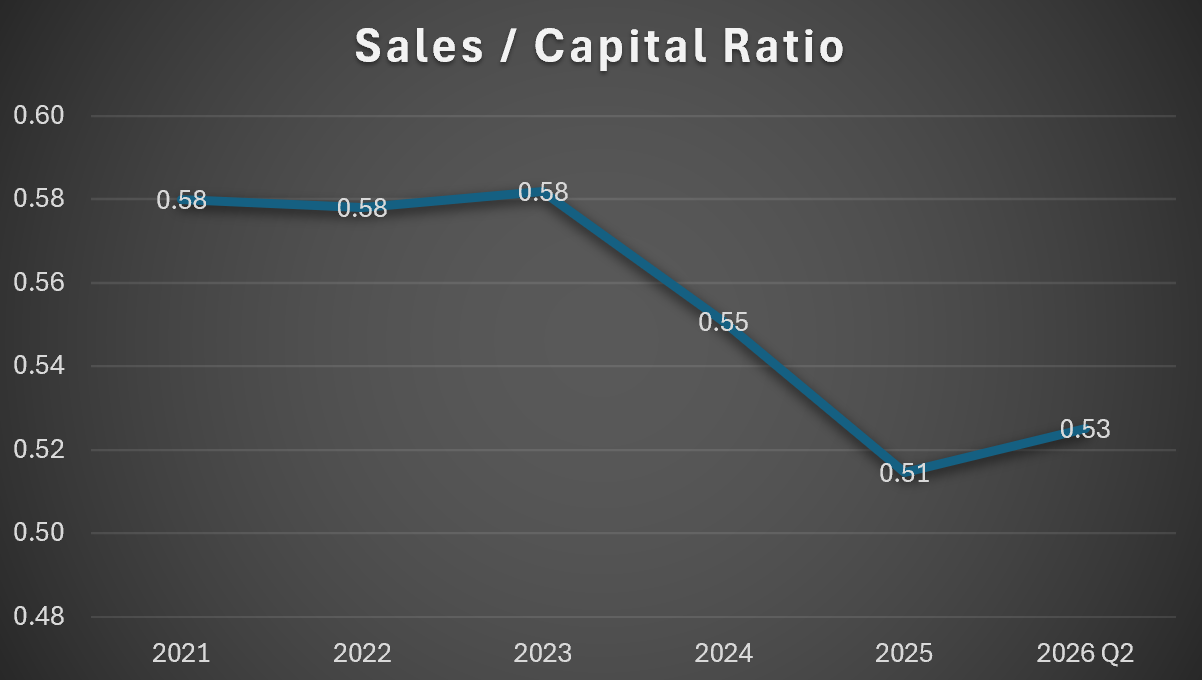
The reinvestment by the company has remained very stable, even if increasing related to company’s sales during the last 2-3 years.
💡I see the company expanding this into ~0.60 driven by the decrease of reinvestment needs given the increase in efficiency described in the Operating Margin section above.
ROIC
Still related with the company’s reivestments, but this time with their return on the capital invested.
This ratio has also seen a slight expansion during the last couple of years::
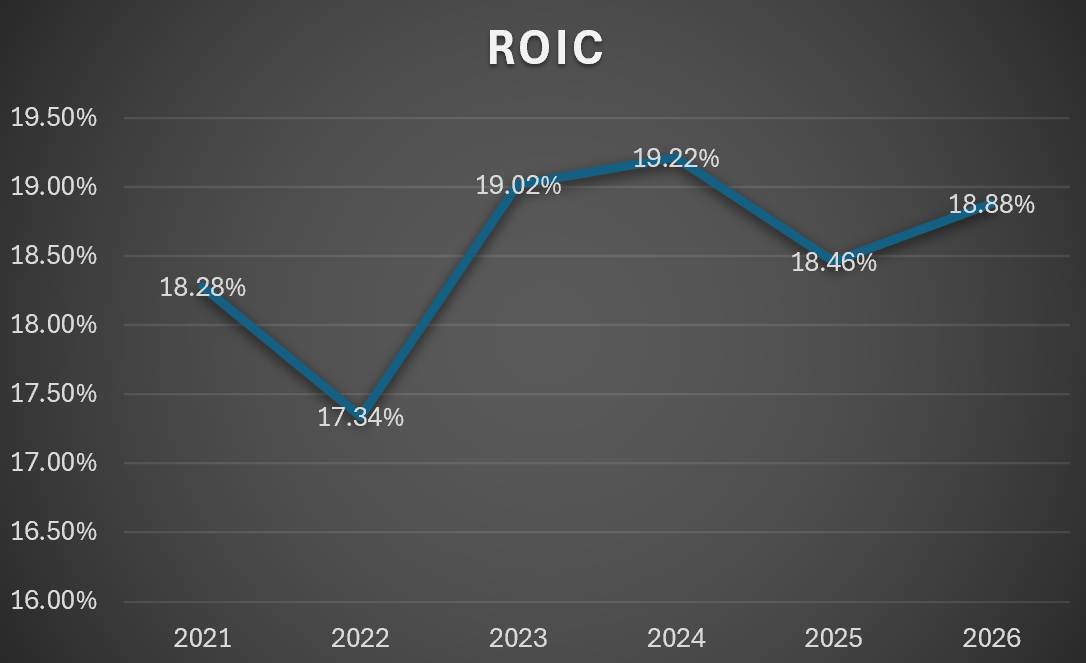
💡My assumption is that the company will still be able to return a little above its cost of capital long-term. I will have it converge to a ROIC of ~15% (above its estimated cost of capital) to a maximum of 18%.
Discounted Cash Flows (Weight: 60%)
I’ve used the latest quarterly and annual reports and my assumptions explained above to complete my Discounted Cash Flow valuation:
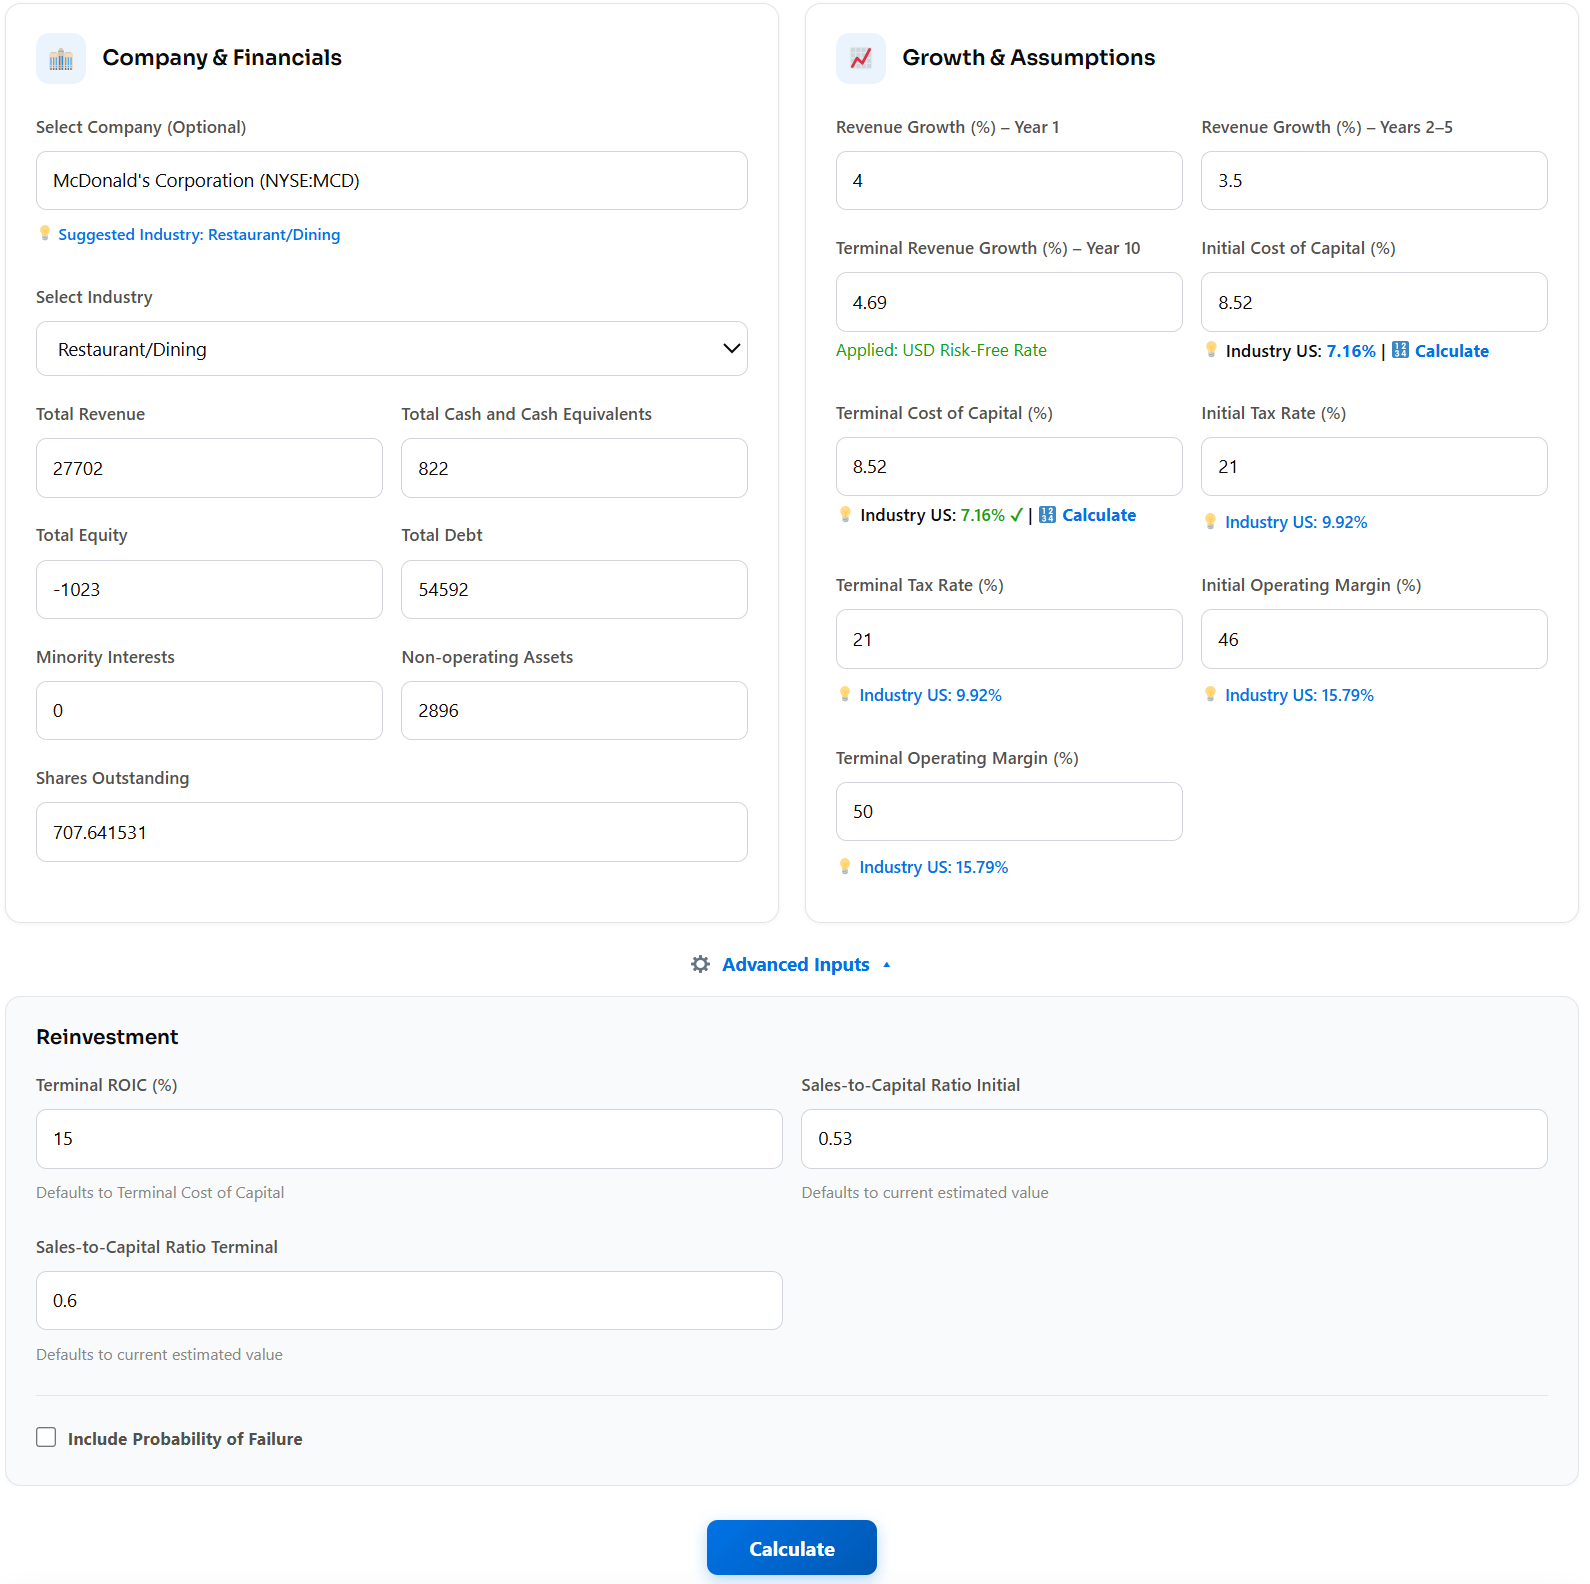

Some notes on the inputs above:
Terminal Revenue Growth – I’m using the risk-free rate (10-Yr bonds of the US), because long term the company should not grow more than the rate of the economy. I’m using the risk-free rate as a proxy to it, so the terminal growth becomes it;
Initial and Terminal Tax Rate – Given the fact that its historical averages are around ~21% I’m assuming the same value for both.
All the other inputs were taken from the financial statement or from my assumptions.
The DCF gives us an estimated fair value of $202.40 dollars for McDonald’s.
Something that we can also do now is to play around with Monte Carlo simulations. What this will allow us to do is to simulate multiple DCF valuations with pre-defined ranges for each of the inputs. Each simulation will randomize the inputs between these pre-defined values. For this I also used my assumptions and the range explained on during those sections.
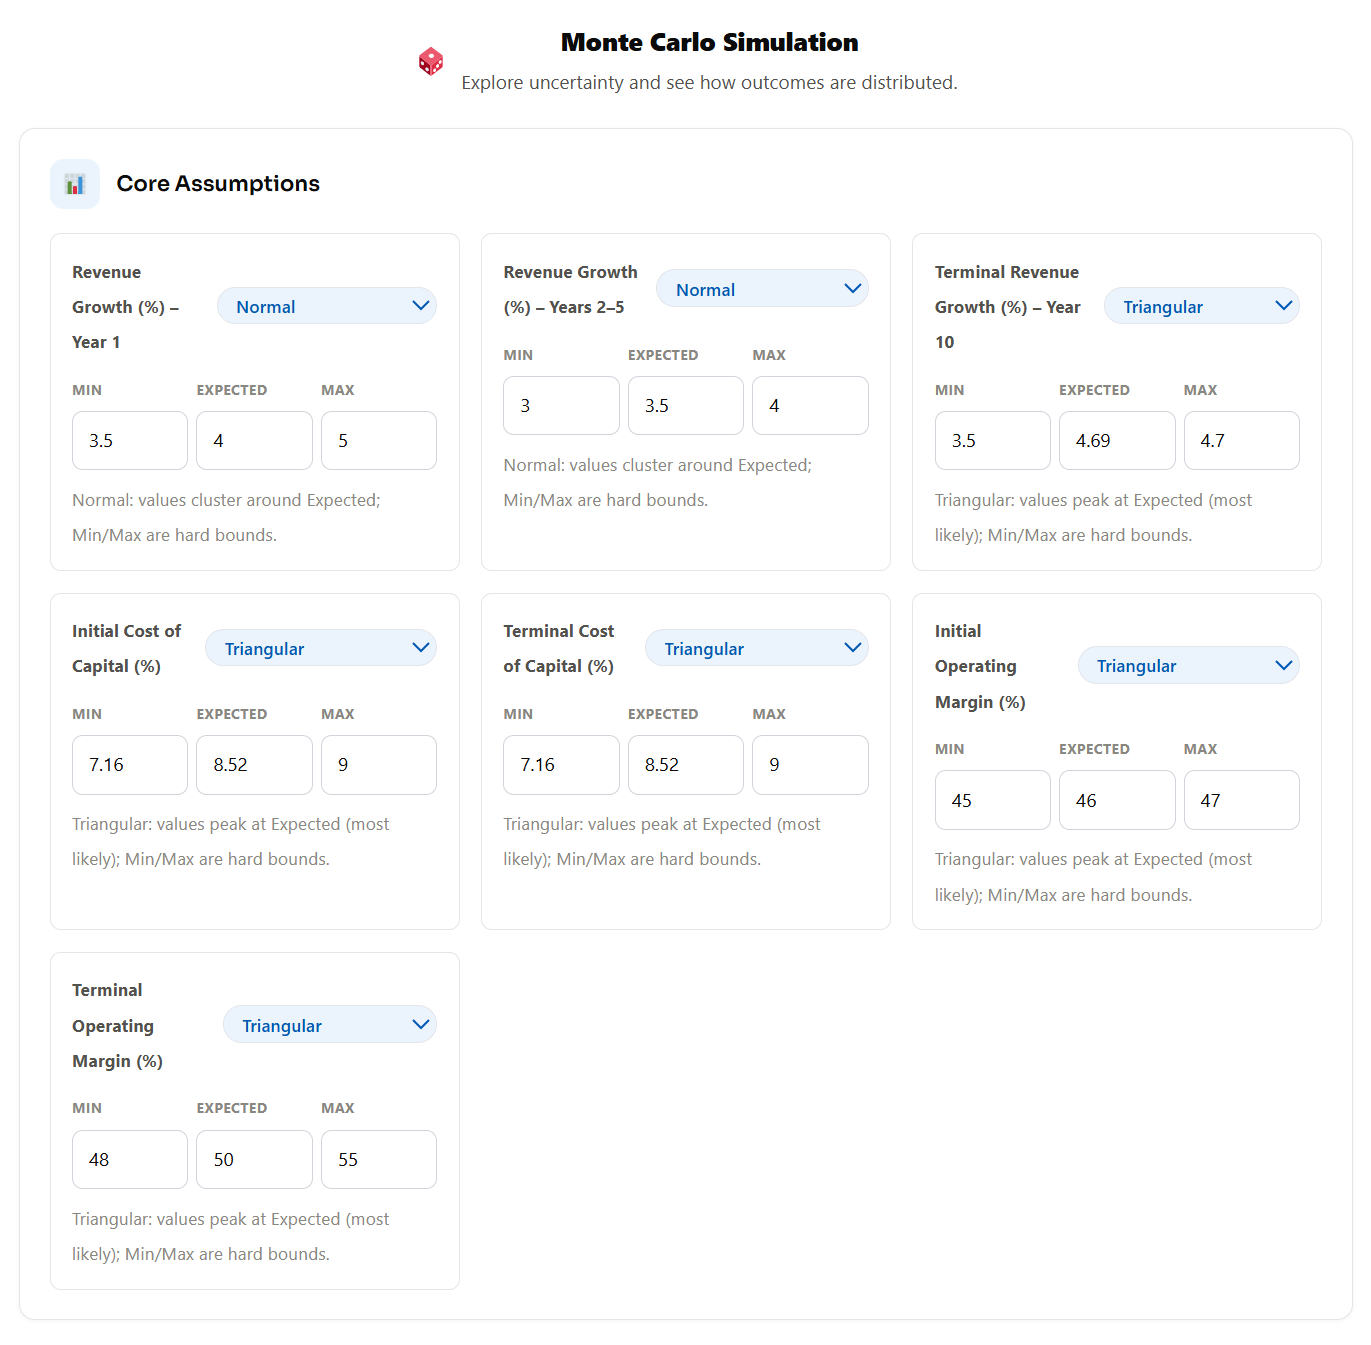
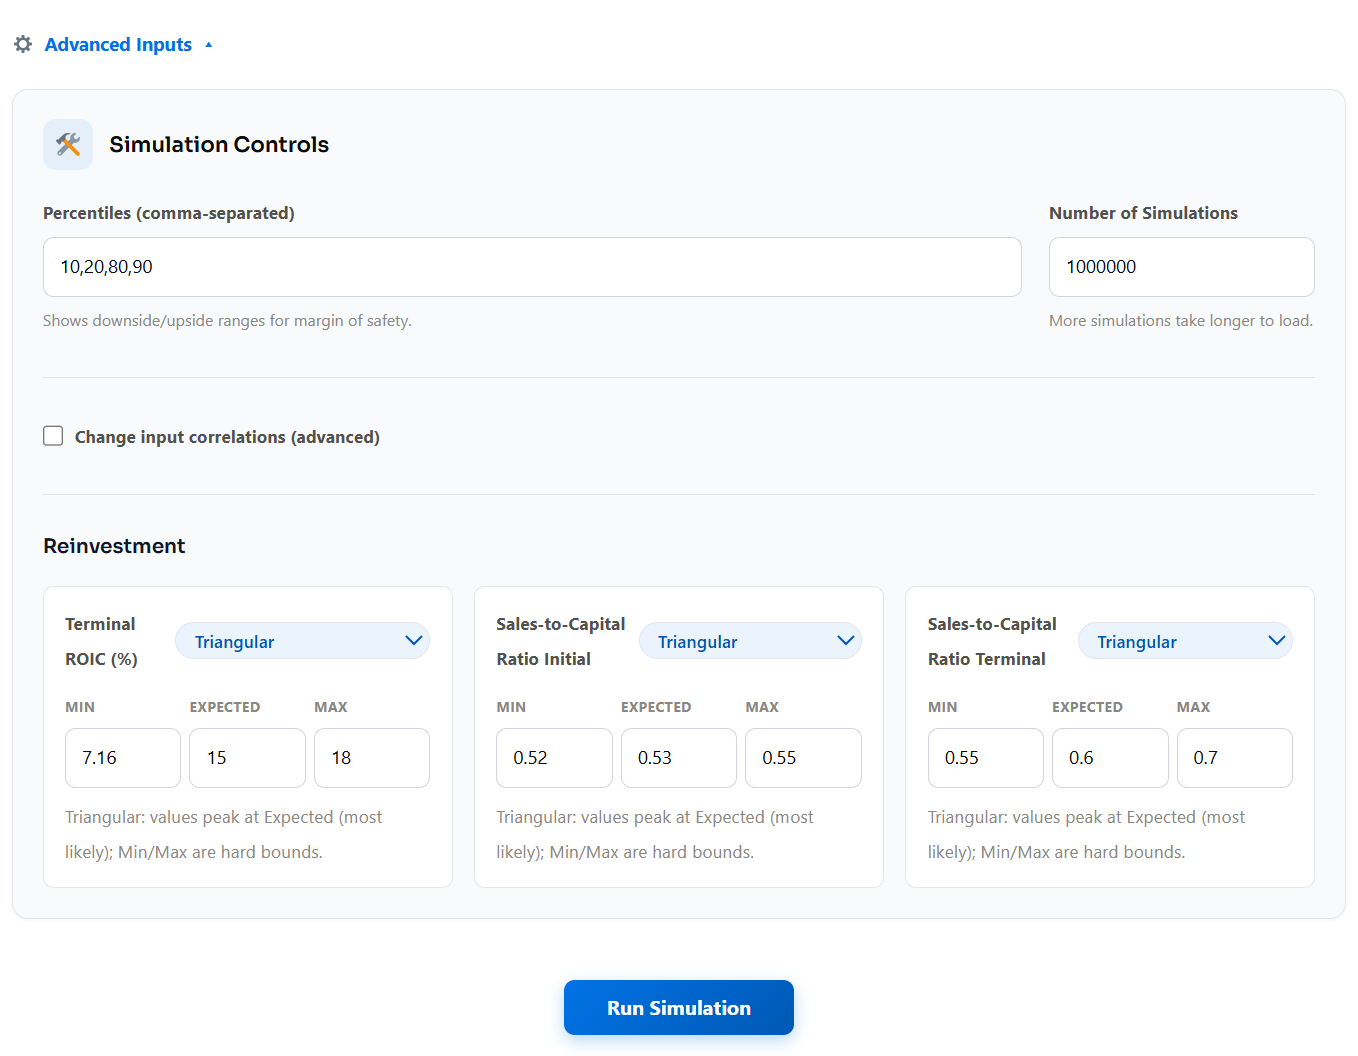
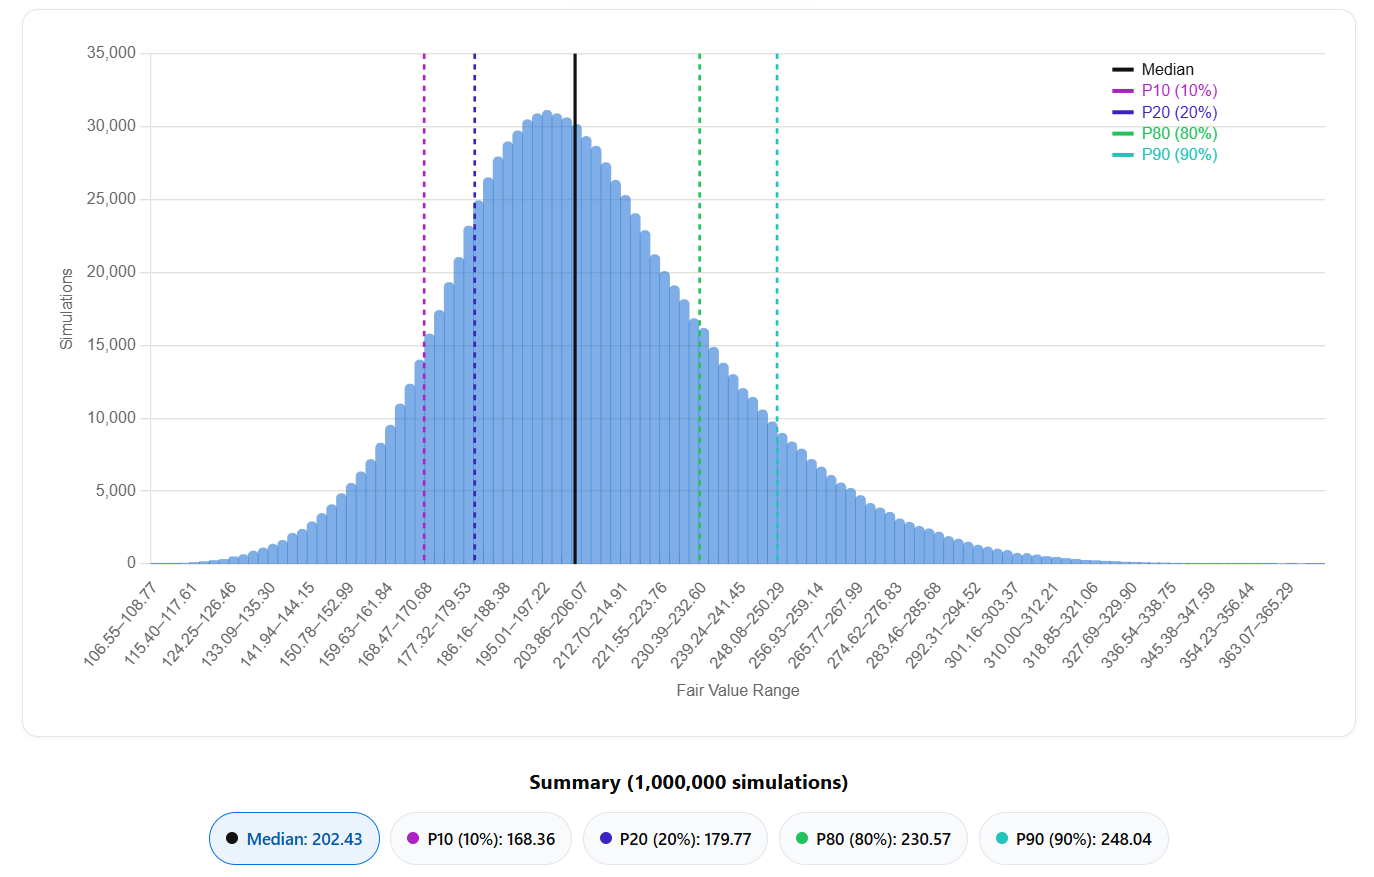
As you can see from the above McDonald’s seems to be overvalued given that its current price of $270 dollars is above P90. From these simulations we can extrapolate that there’s more than ~90% probability of McDonald’s being overvalued.
Please be free, as before, to fill in your own values. Make the valuation your own and do yourself a DCF valuation using your own assumptions: DCF – The Fair Value Journal
EPS Growth (Weight: 40%)
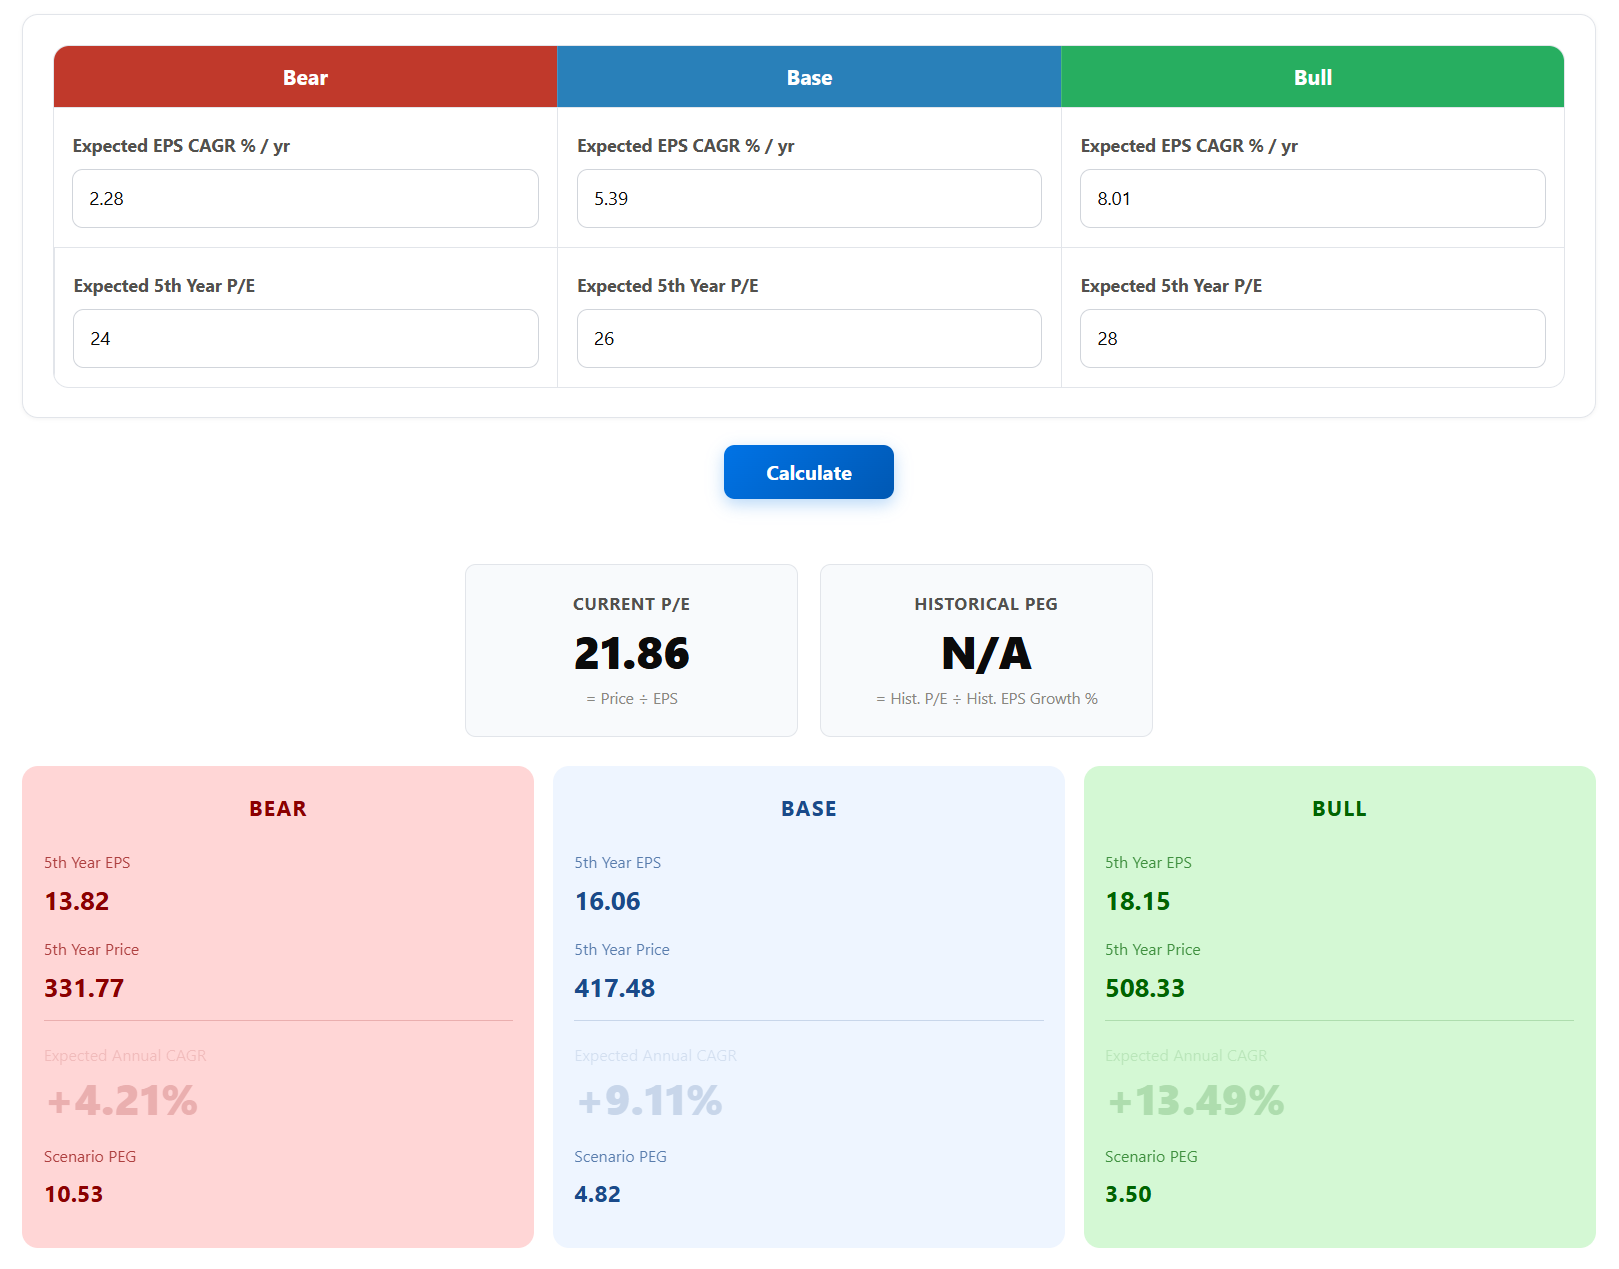
For the EPS valuation, I designed three different scenarios, to be used later on the Monte Carlo simulation: a bad, a base and a good scenario. Everything about them is explained below.
Please note that the last Trailing Twelve Months (TTM) EPS for the company is $12.35.
Also some relevant historical notes about the company:
Revenue Growth (CAGR)
1 Year | 3 Years | 5 Years | 10 Years |
|---|---|---|---|
3.72% | 5.06% | 6.96% | 0.98% |
💡 This was discussed earlier, but it is expected for the company to grow its revenues below the economy growth rate, so around ~3-5% (higher probability on the lower end).
Shares Outstanding (CAGR)
1 Year | 3 Years | 5 Years | 10 Years |
|---|---|---|---|
-0.64% | -0.95% | -0.95% | -1.57% |
💡 McDonald’s has been buying back shares, I believe this will be maintained between -0.50% and -1.50%.
Net Profit Margin (Average)
1 Year | 3 Years | 5 Years | 10 Years |
|---|---|---|---|
31.79% | 30.86% | 30.09% | 27.84% |
💡 As we discussed previously during the operating margin section, I expect this margin to expand into the range ~30-34% (higher probability on the upper end).
P/E ratio (Average)
1 Year | 3 Years | 5 Years | 10 Years |
|---|---|---|---|
25.55 | 27.08 | 28.17 | 26.71 |
💡 I expect this to also remain around the same historical values around ~24-28.
Knowing this, these were my three scenarios for the next 5 years:
Bad Scenario
Revenue Growth (CAGR): 3.00%
Net Profit Margin (Average): 30.00%
Shares Outstanding (CAGR): -0.50%
P/E ratio: 24
EPS 5th Year: $13.82
EPS CAGR: 2.28%
Base Scenario
Revenue Growth (CAGR): 3.60%
Net Profit Margin (Average): 33.00%
Shares Outstanding (CAGR): -1.00%
P/E ratio: 26
EPS 5th Year: $16.06
EPS CAGR: 5.39%
Good Scenario
Revenue Growth (CAGR): 5.00%
Net Profit Margin (Average): 34.00%
Shares Outstanding (CAGR): -1.50%
P/E ratio: 28
EPS 5th Year: $18.15
EPS CAGR: 8.01%
Given these assumptions and based on the historical data, I filled in and valued the company using the EPS Growth projections, discounted by the estimated cost of capital previously calculated and using the assumptions of the base scenario.
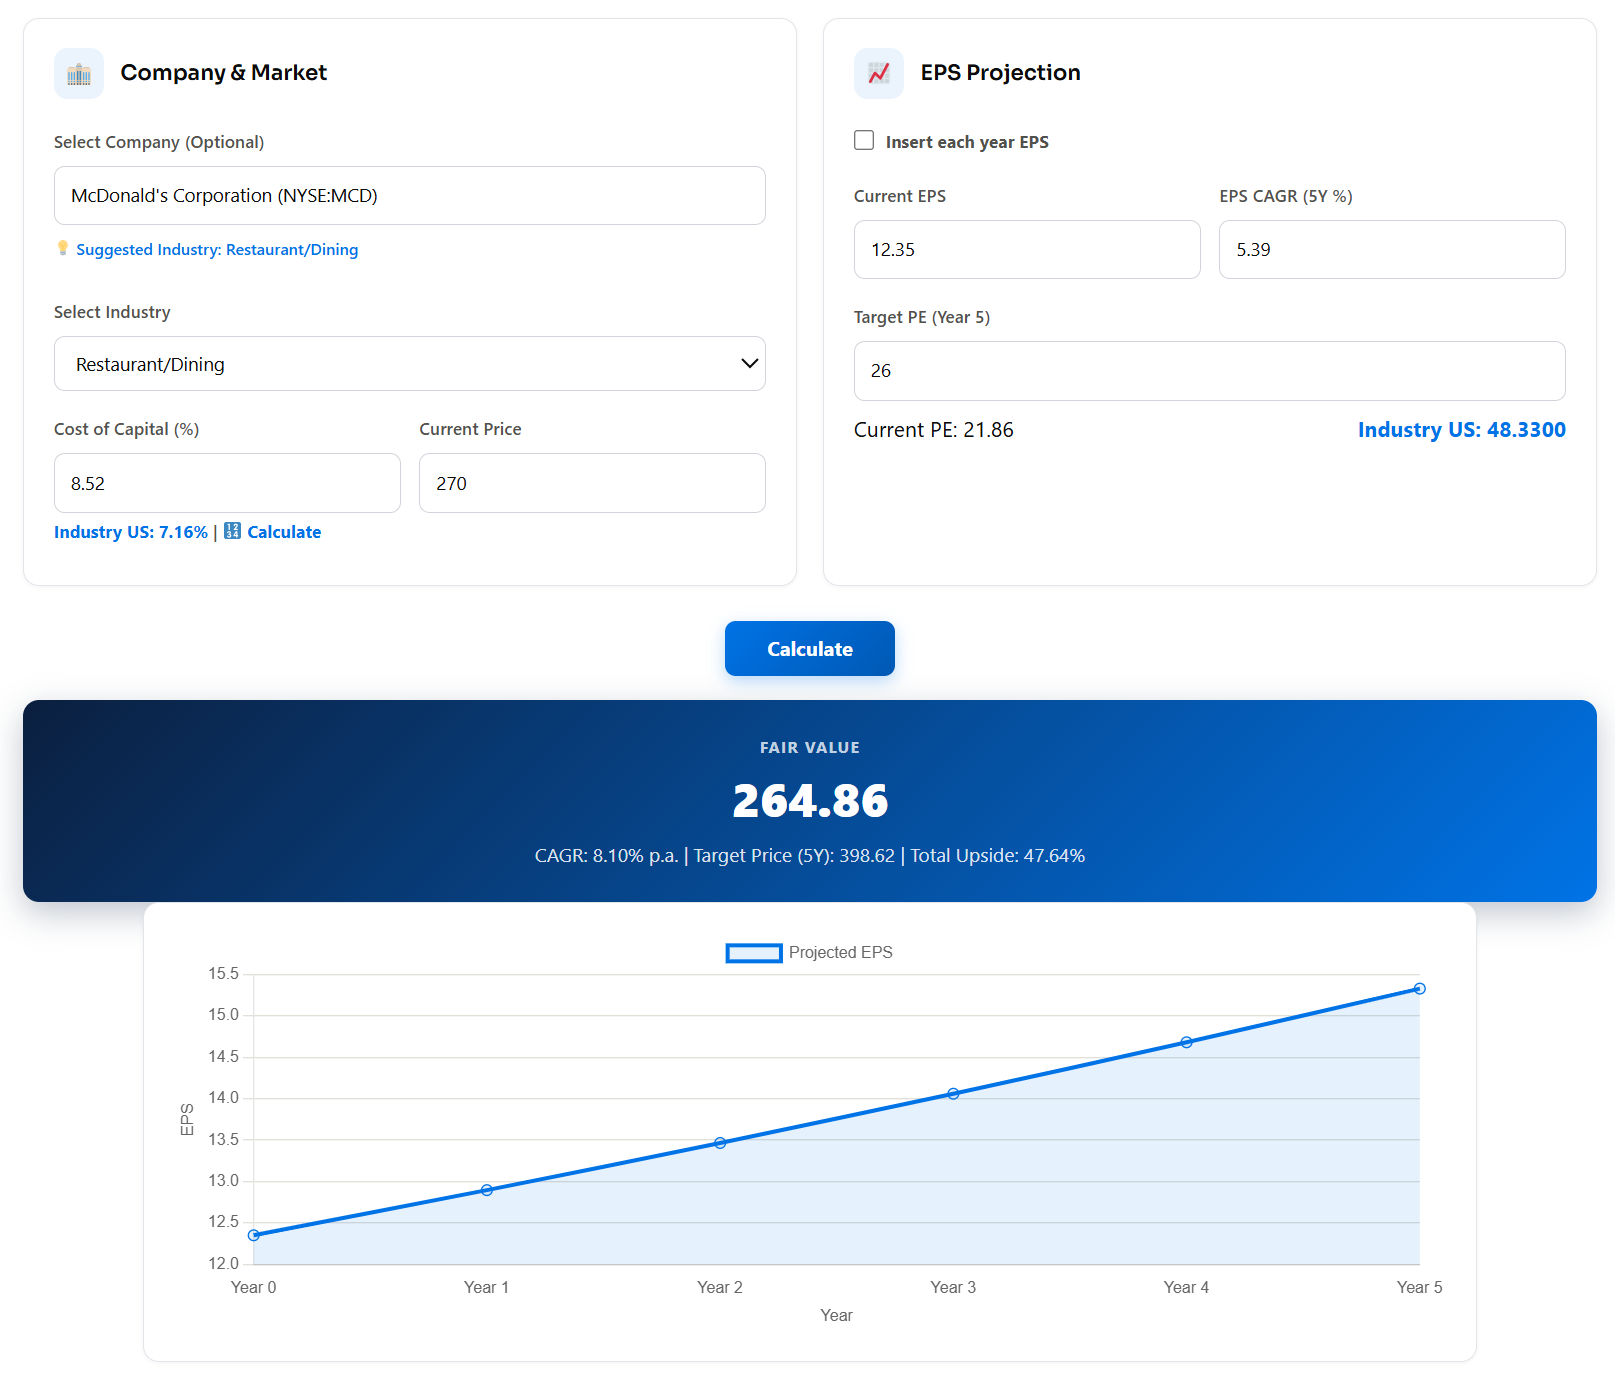
Then again, I used the Monte Carlo simulations to explore the possibilities on the lower (bad scenario) and on the higher (good scenario) end.
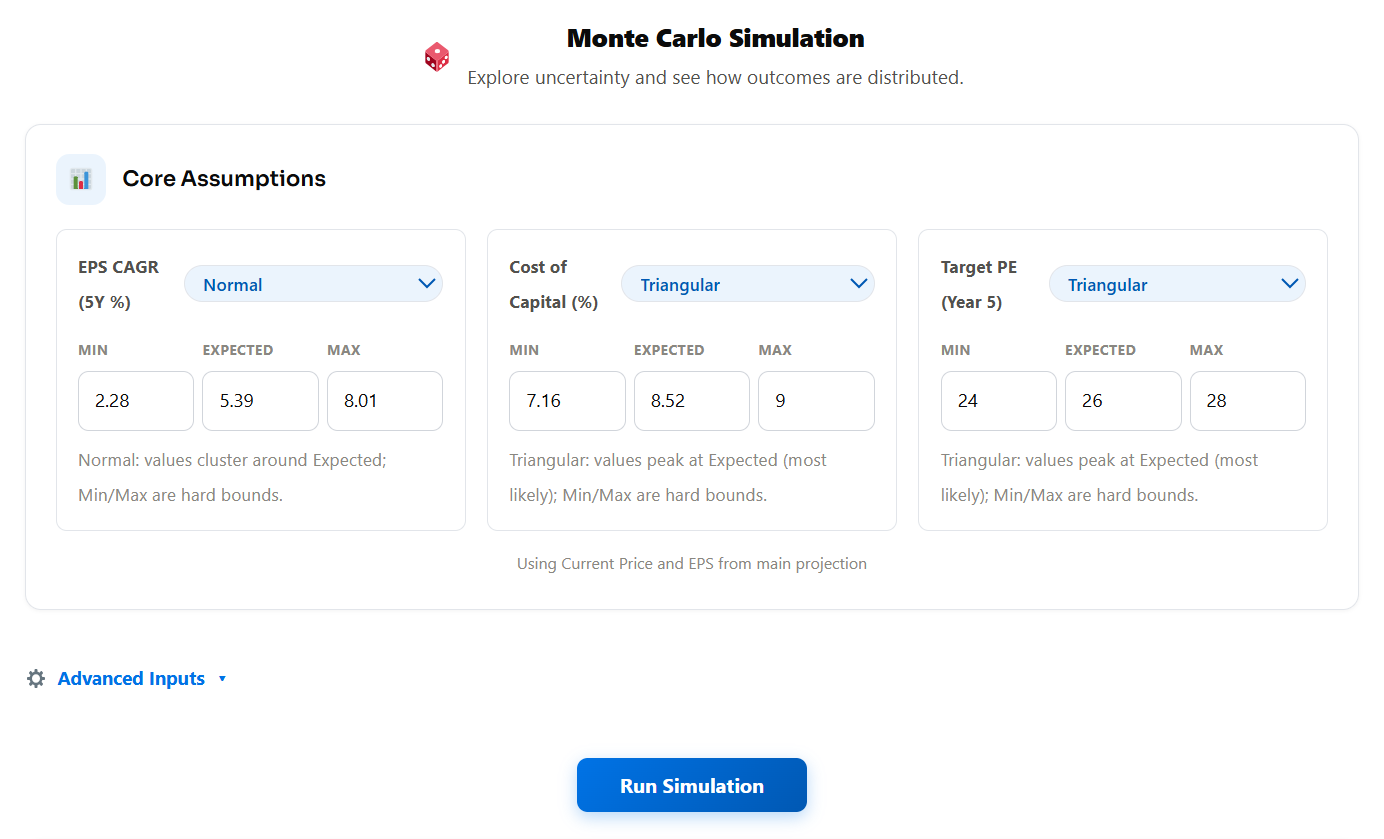
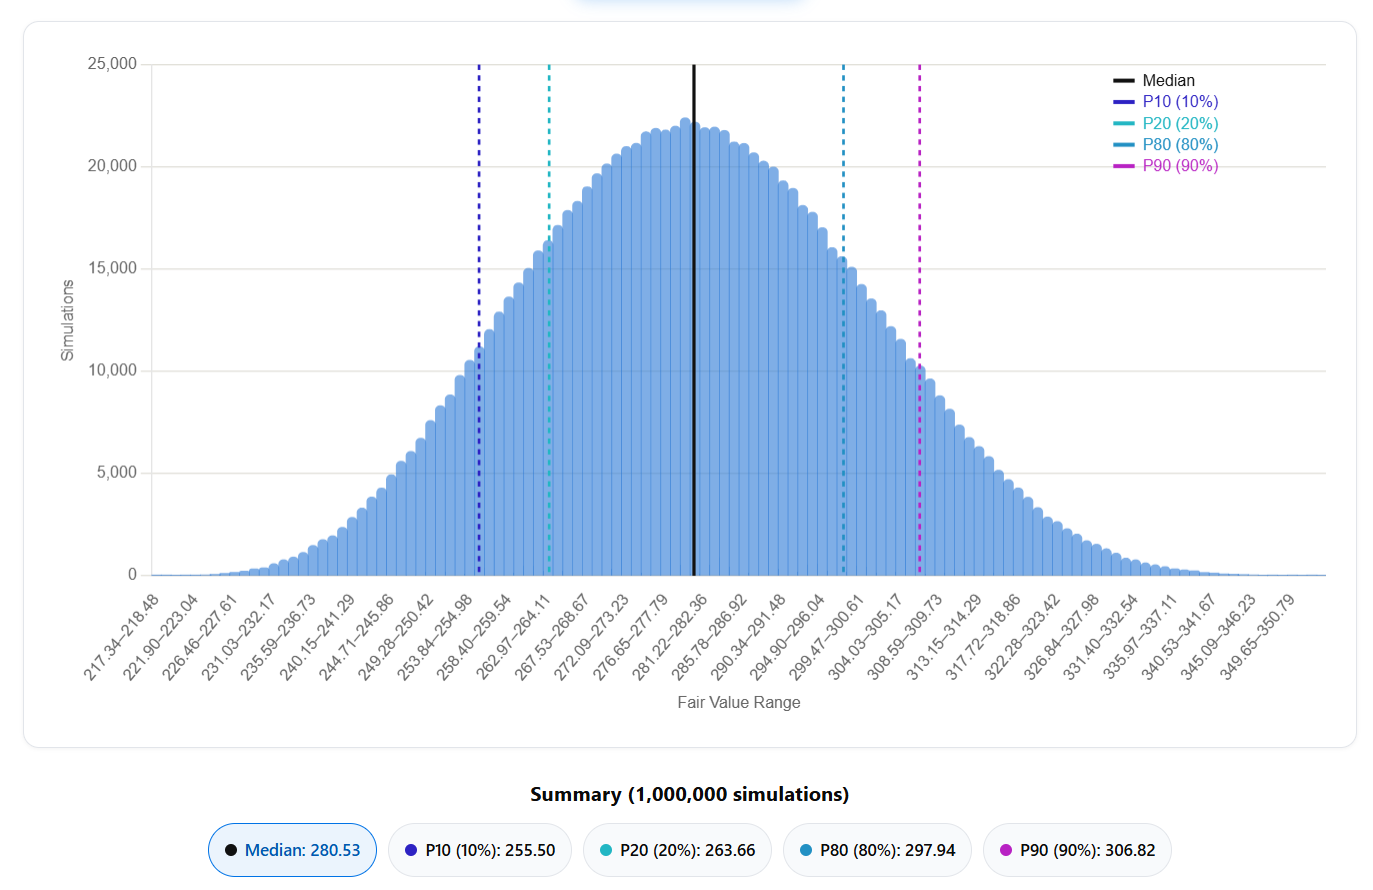
From this valuation, McDonald’s looks fairly valued or at most a little undervalued given that its current price of $270 dollars is between P20 and the Median. We can extrapolate that there’s ~50-80% probability of the company being undervalued.
As before, feel free to try this yourself: EPS Growth – The Fair Value Journal
EPS Scenario Returns
We can also explore a little further the different scenarios by projecting in time the bad, the base and the good case scenarios.
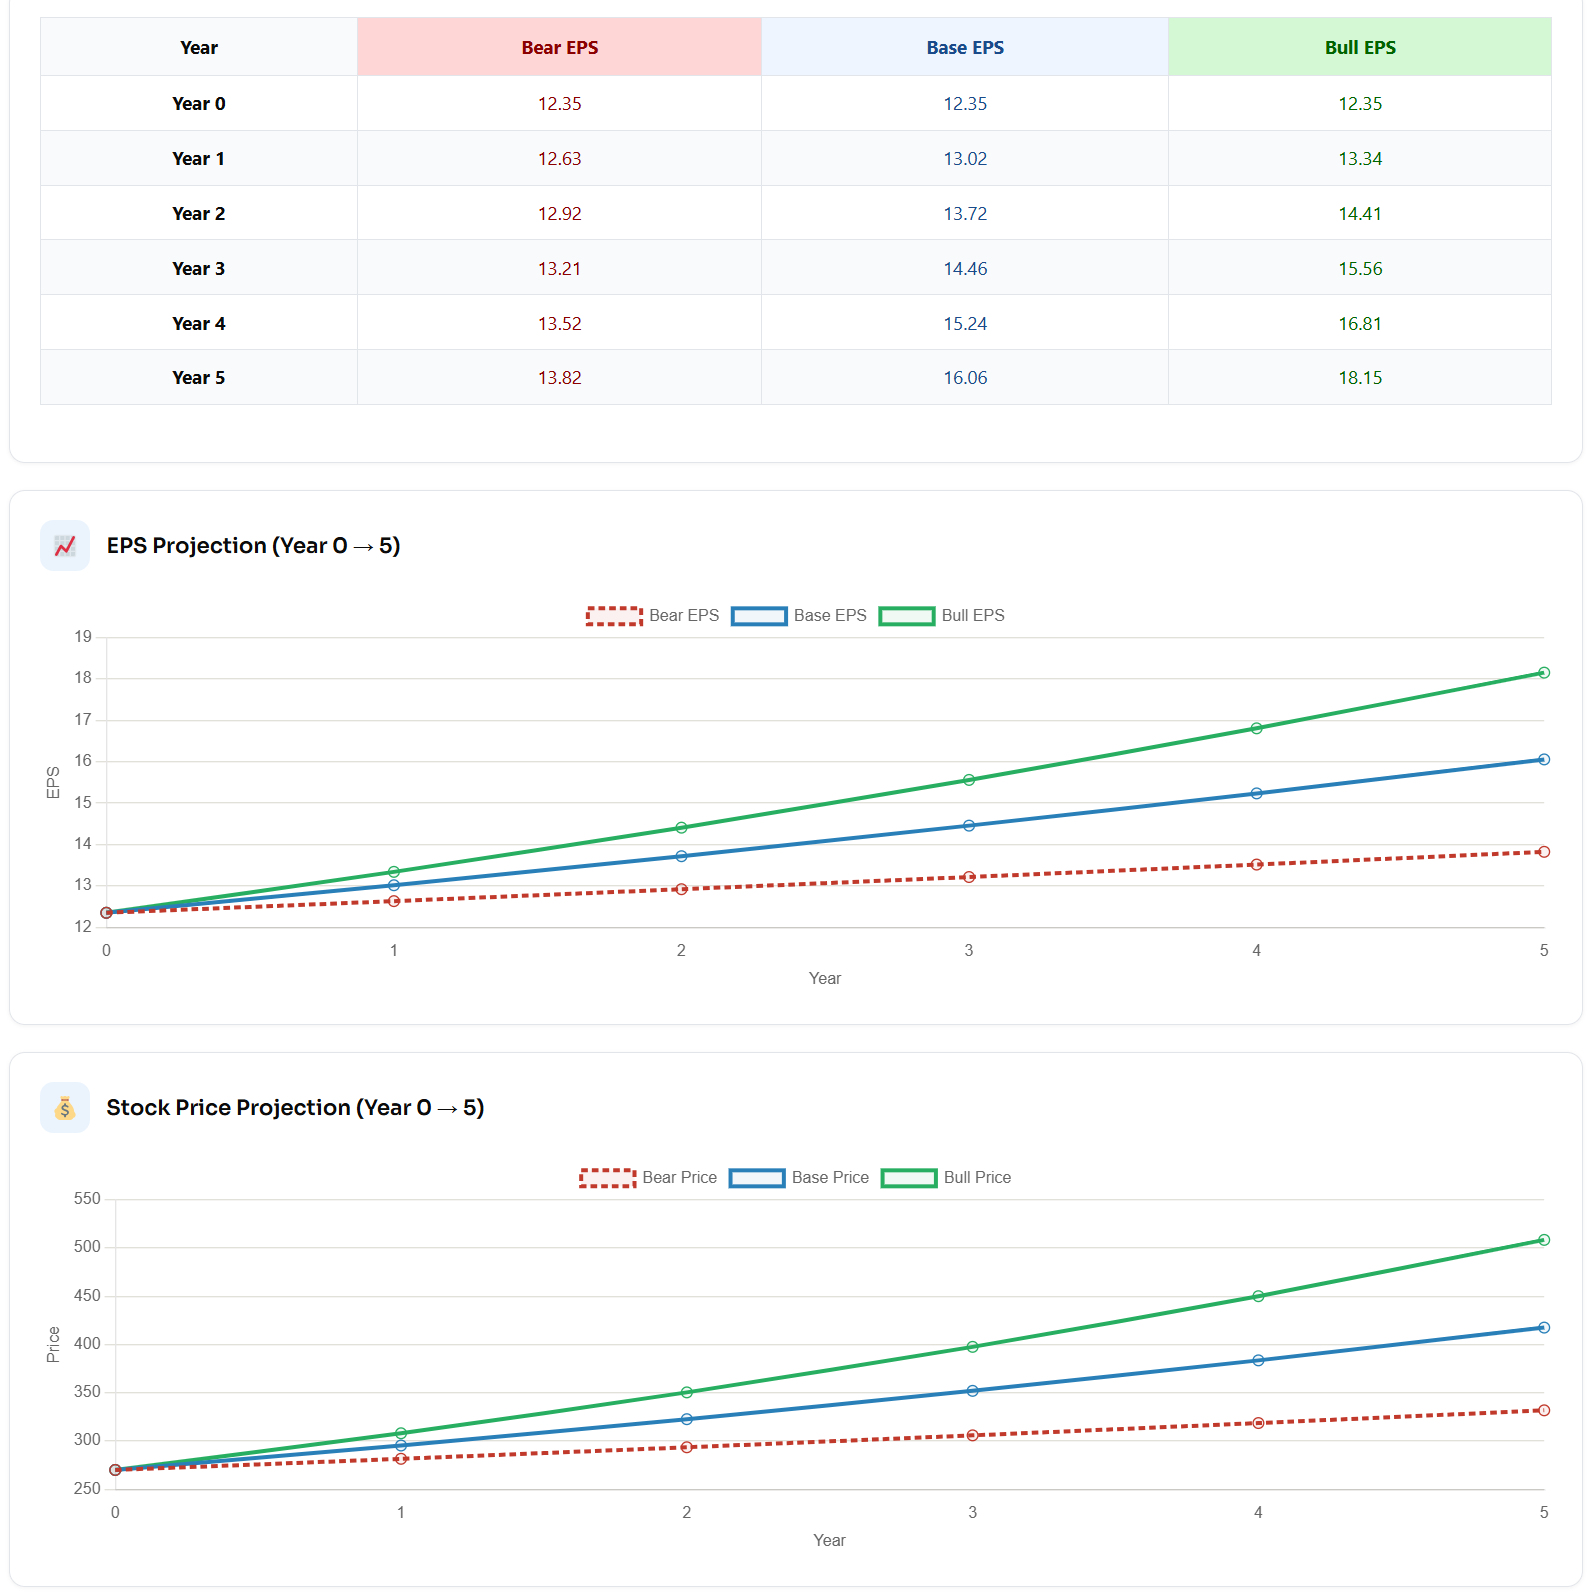
Feel free to try this yourself: EPS Scenario Returns — The Fair Value Journal
✍️Summary
Now that we did all the heavy work, let’s take all of the above and come up with the company weighted average fair value.
I basically take each valuation method used and given my confidence on the company apply a 20% or 10% discount (when to buy) and addition (when to sell) or use the Monte Carlo P10, P20, P80 and P90 values.
Remember, a lower fair value represents the likelihood of a worst-case scenario playing out, while a higher fair value reflects the potential of a best-case scenario unfolding.
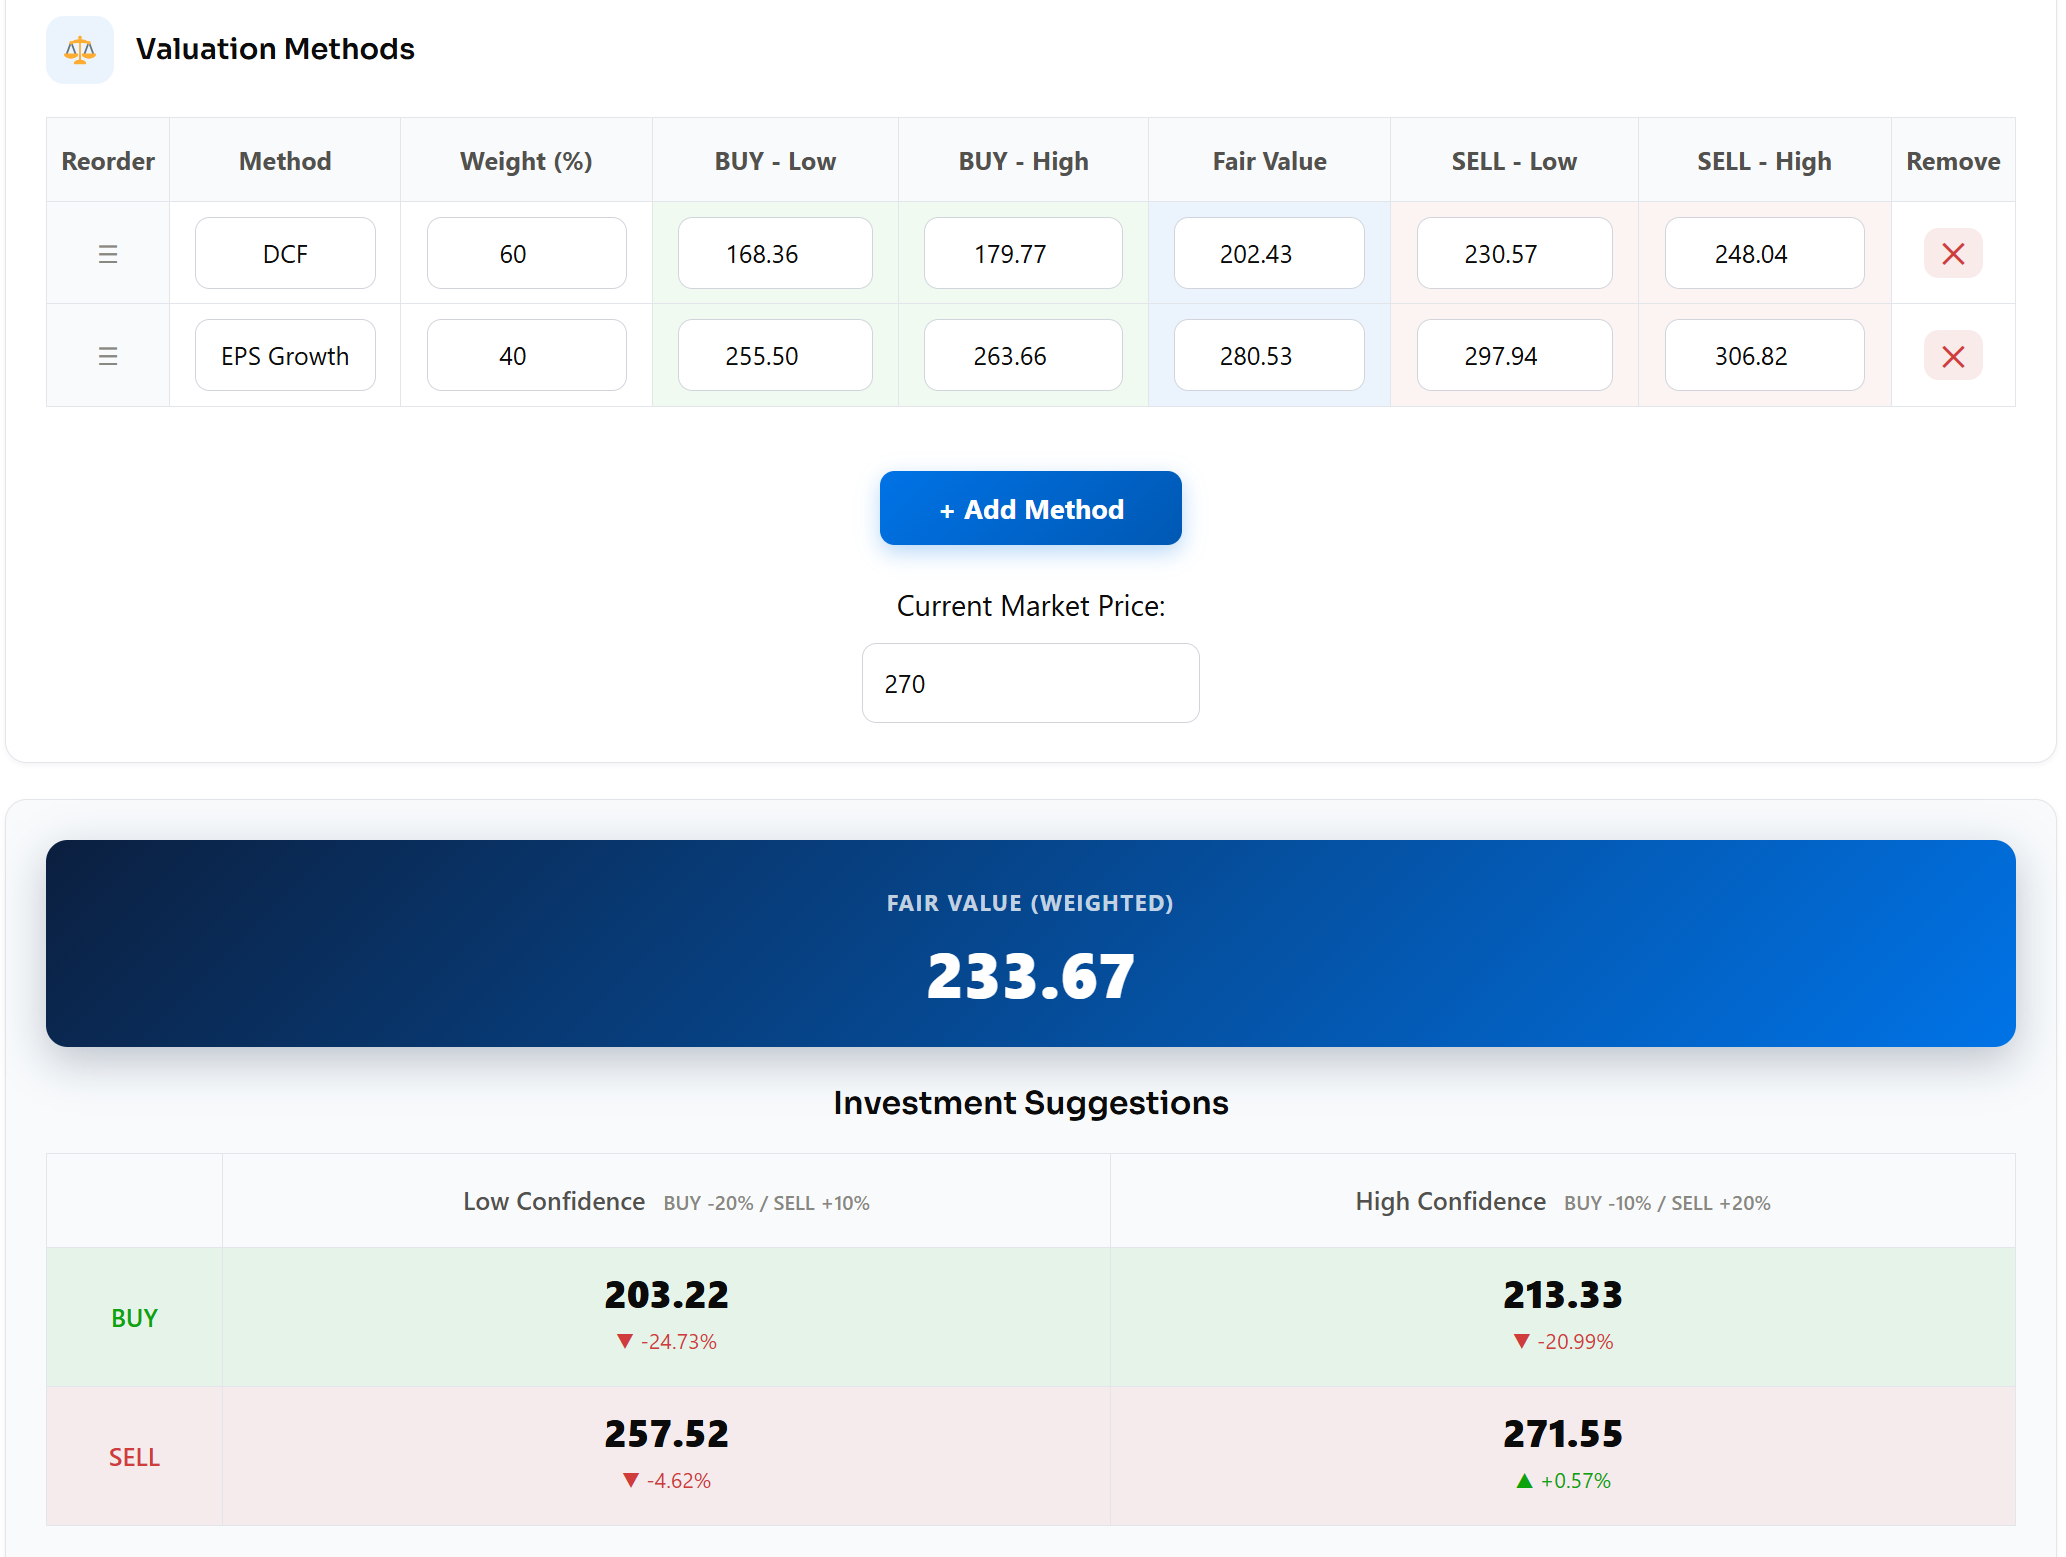
Feel free to choose your own values, but for me I would start adding again or initiating a position in McDonald’s below $213.33, because this is indeed a great business, a company I really like and know very well.
Please, as always, remember that the fair value estimate has a 100% probability of being wrong and it will never be a precise number, even if it has decimals next to it 😮
Back in my high school days working there, I saw in Portugal the shift to kiosks and the table RFID delivery system—things that are now second nature and seamlessly integrated. It makes me feel confident about their AI integration and the company’s future. Long story short, I really like this company, and I’m totally biased about it 😏
Despite this, as a long-term investor in the company, I consider it a hold for now. McDonald’s appears to be overvalued at its current market price.
Fair Value: 233.67 dollars.