
🏠Business Overview
🎯Key Metrics
Total: 1/17
+2 ✅ Projected Operating Margin: 45.47%
+0 ⚠️ Projected 5-Year Revenue CAGR: 4.70%
+0 ⚠️ Last 5-Year ROIC: 2.52%
-2 ❌❌ Estimated Cost of Capital: 7.11% (higher than ROIC)
-1 ❌ Last 5-Year Shares Outstanding CAGR: +12.11%
+1 ✅ Projected 5-Year EPS CAGR: 11.68%
+0 ⚠️ Projected 5-Year Dividend CAGR: 2.50%
+1 ✅ Moody’s Rating: A3
-2 ❌❌ Morningstar Moat: None
+2 ✅✅ Morningstar Uncertainty: Low
Realty Income is the standard in REITs. Having paid a monthly dividend over 32 years ininterrupted (starting at 1994), every investor that wants to have a secure and reliable source of dividend income has a position or had some kind of investment in this company over time.
Don’t take the key metrics above for this type of business very seriously. Yes, the growth for a REIT company will be slow and overall tedious, however, the security and reliability its dividend payment offers is hard to come by in other industries, namely because this type of business is regulated to return most if not all of its free cash flow in dividend payments to its shareholders. Given this, you can expect reliable and safe growing dividends, despite the fact the growth of these payments may increase below the economy growth rate.
Below, we will value this company mainly for the projected dividend payments it will offer you in the future.
Please note, as always, that this are only my assumptions taking into account the current state of the business, its historical data and my own projections for its future. Take everything here with a grain of salt, I will guide you through my thought processes but provide you with the tools so you can override and change everything and come up with your own value for the company. As with anything, take responsability for your own investment decisions.
📈Business Valuation
Given the fact that Realty Income is a dividend focused company, I will value it using only valuation methods related with dividends. A fundamentally driven one and then a historical/relative one to sanity check.
Dividend Discount Model (Stable Growth) – we will project in time all the dividend payments we will receive from the company, growing below the economy growth rate and then discount it back to the present day using an estimated cost of equity;
Historical Dividend Yield – here we will check its current dividend yield against its historical median.
Dividend Growth
To get a sense how the company may grow its dividends in the future, let’s check how the company has been growing its dividends each year. Below is the last ~15 years of dividend growth for Realty Income:
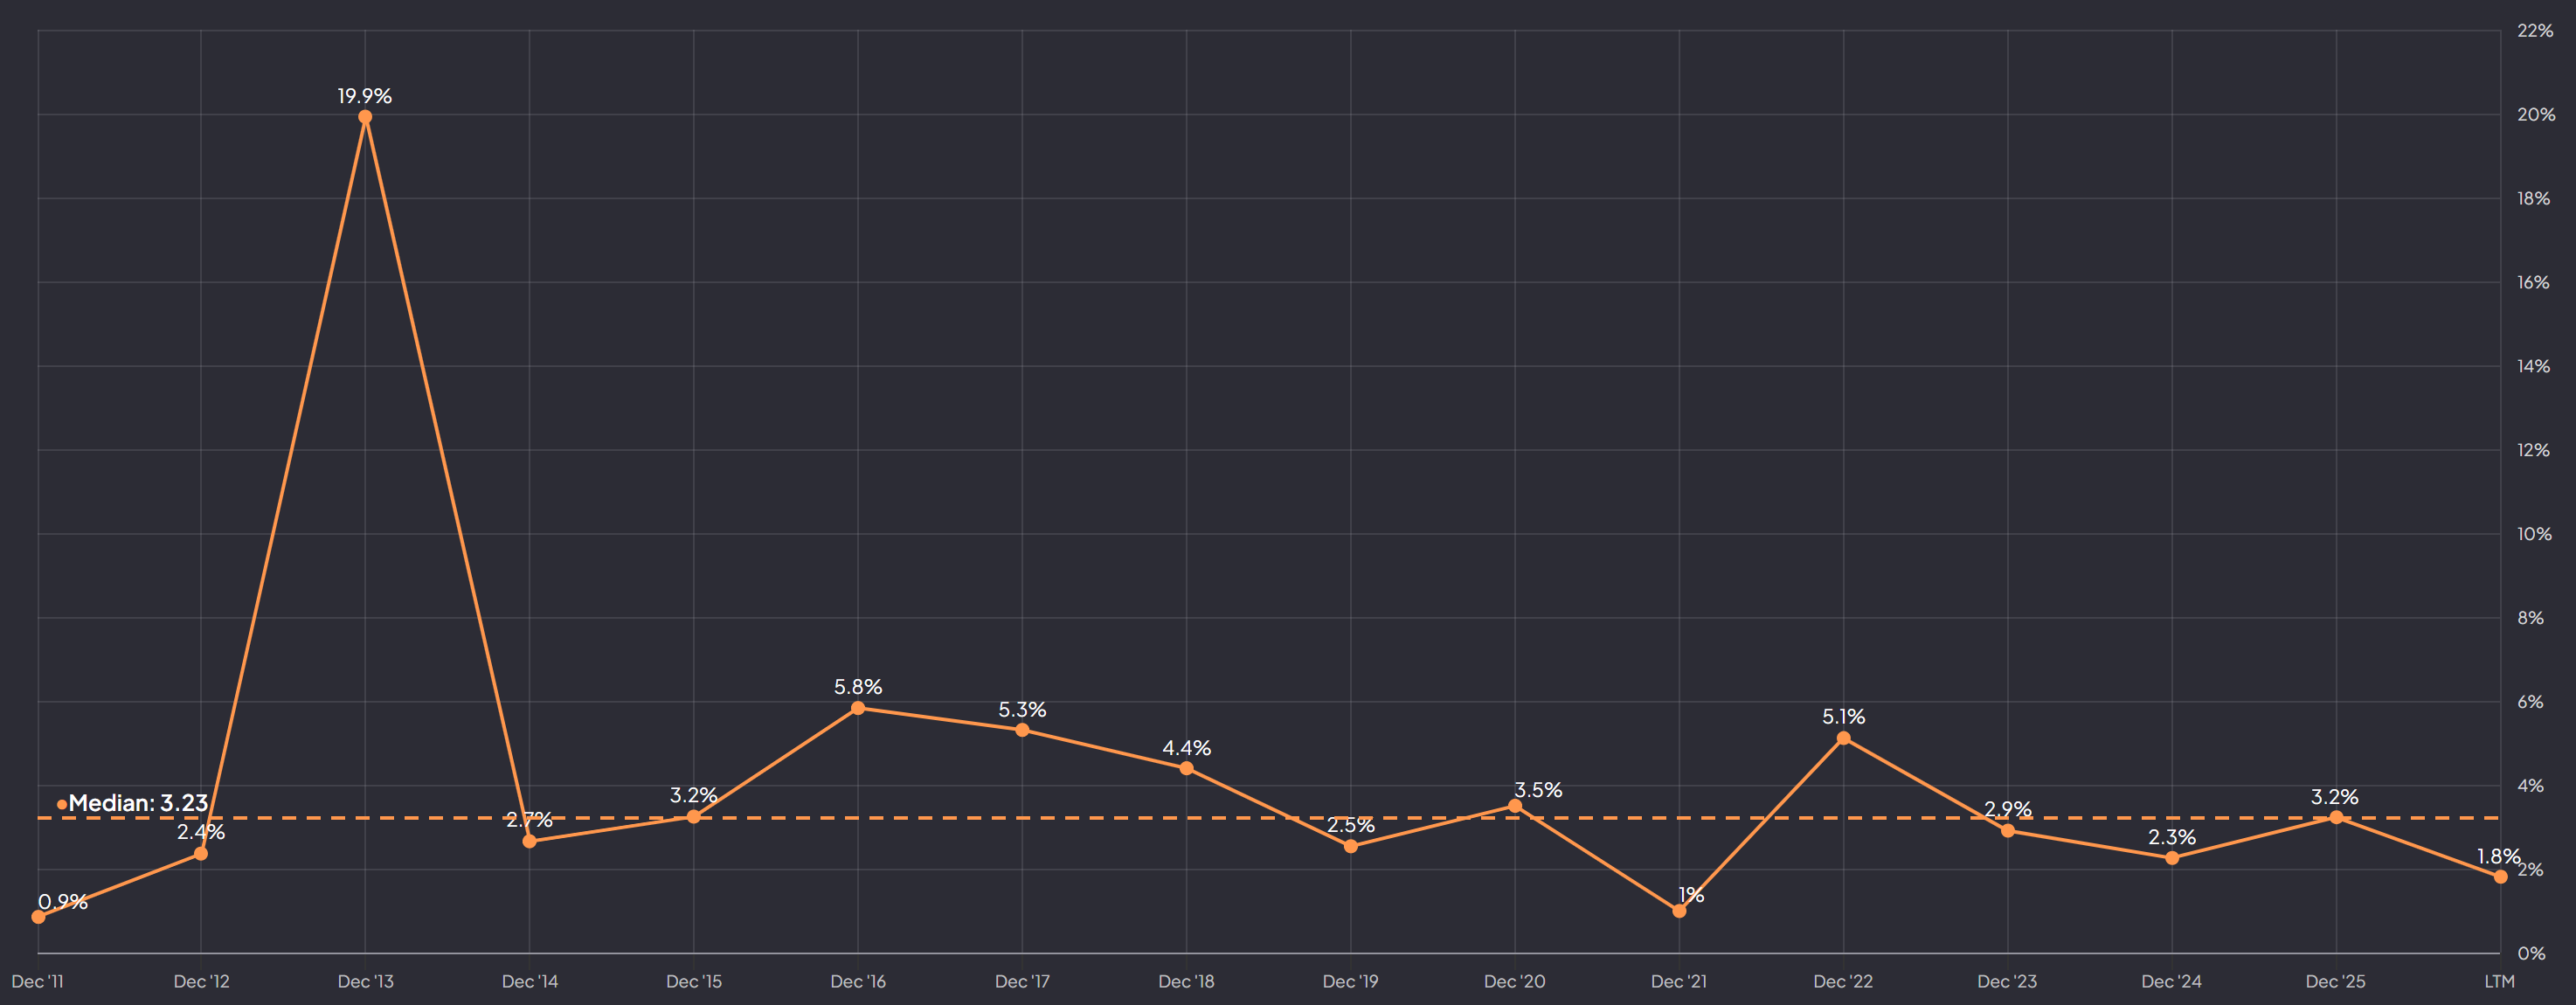
Given the maturity of the business, its historical data and the fact that I project a higher interest rate environment over the next couple of years, I believe the company will grow it’s dividends at around ~2.5% so below the economy growth rate of ~4.95% (10-Year U.S. bond rate).
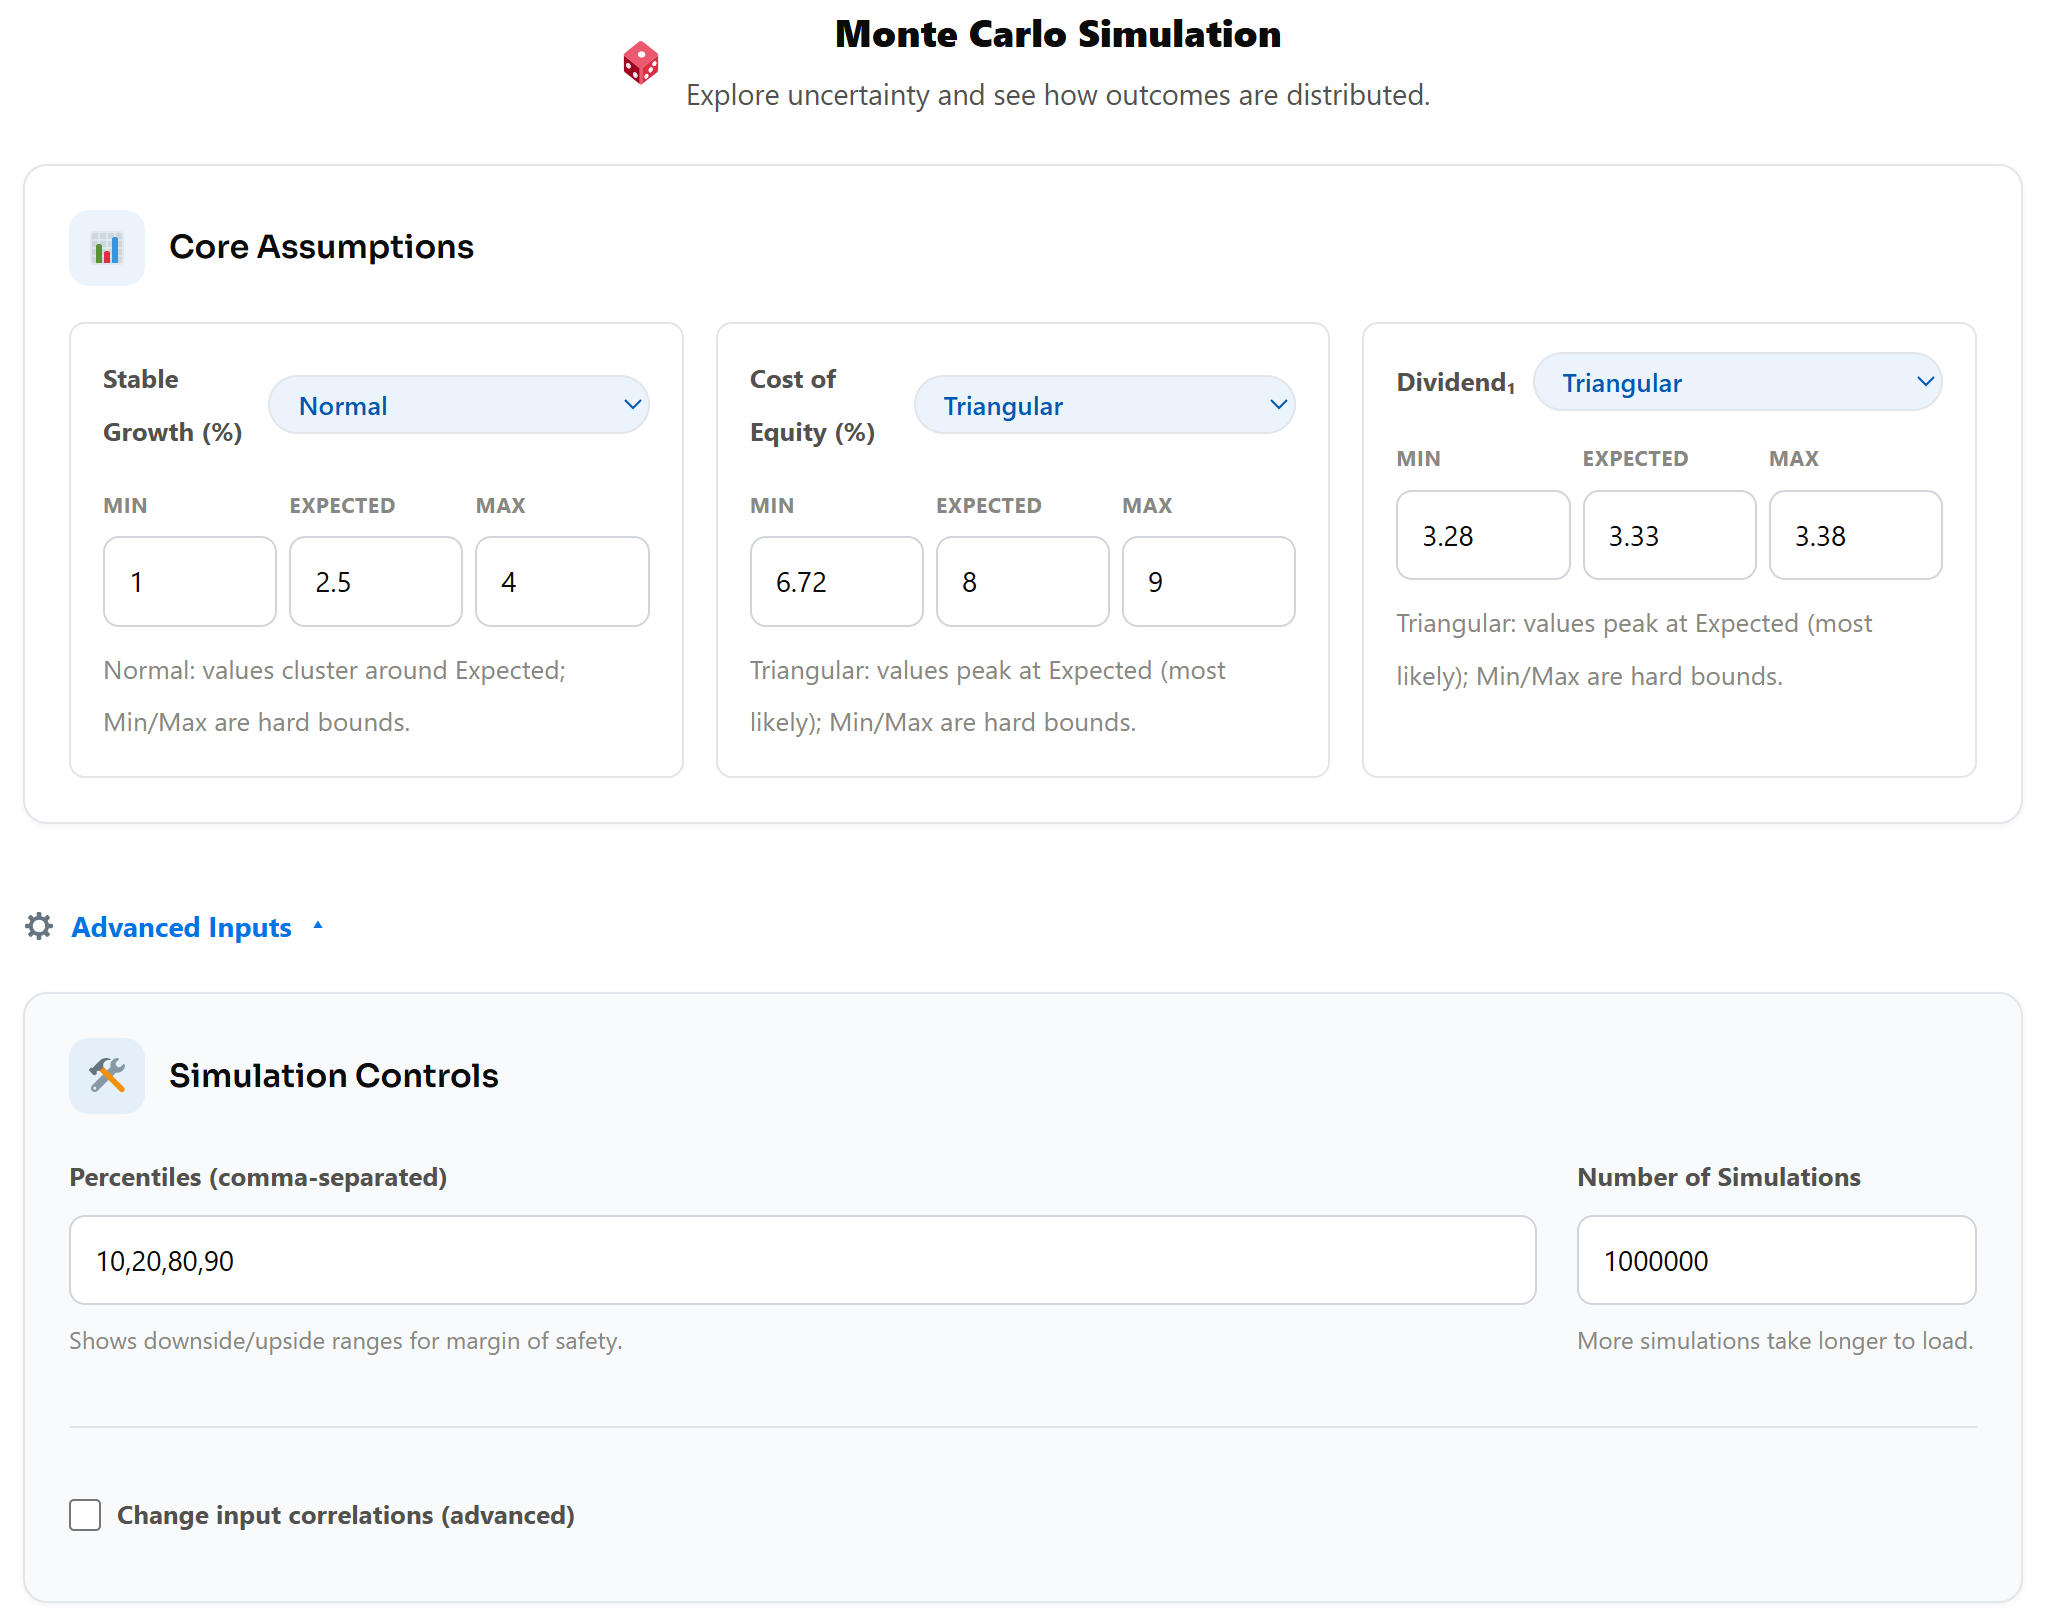
I will explore later on the Monte Carlo simulations a scenario where the growth shrink to 1% if everything goes really crazy and another where the growth expands to 4% if we go back to a better than median scenario.
Note that all of these scenarios are growing below the economy growth rate and because of this I will use a Stable Growth model to value the company using the Dividend Discount Model.
Dividend Payments
We can also check the historical ~15 years of dividend payments for the company:
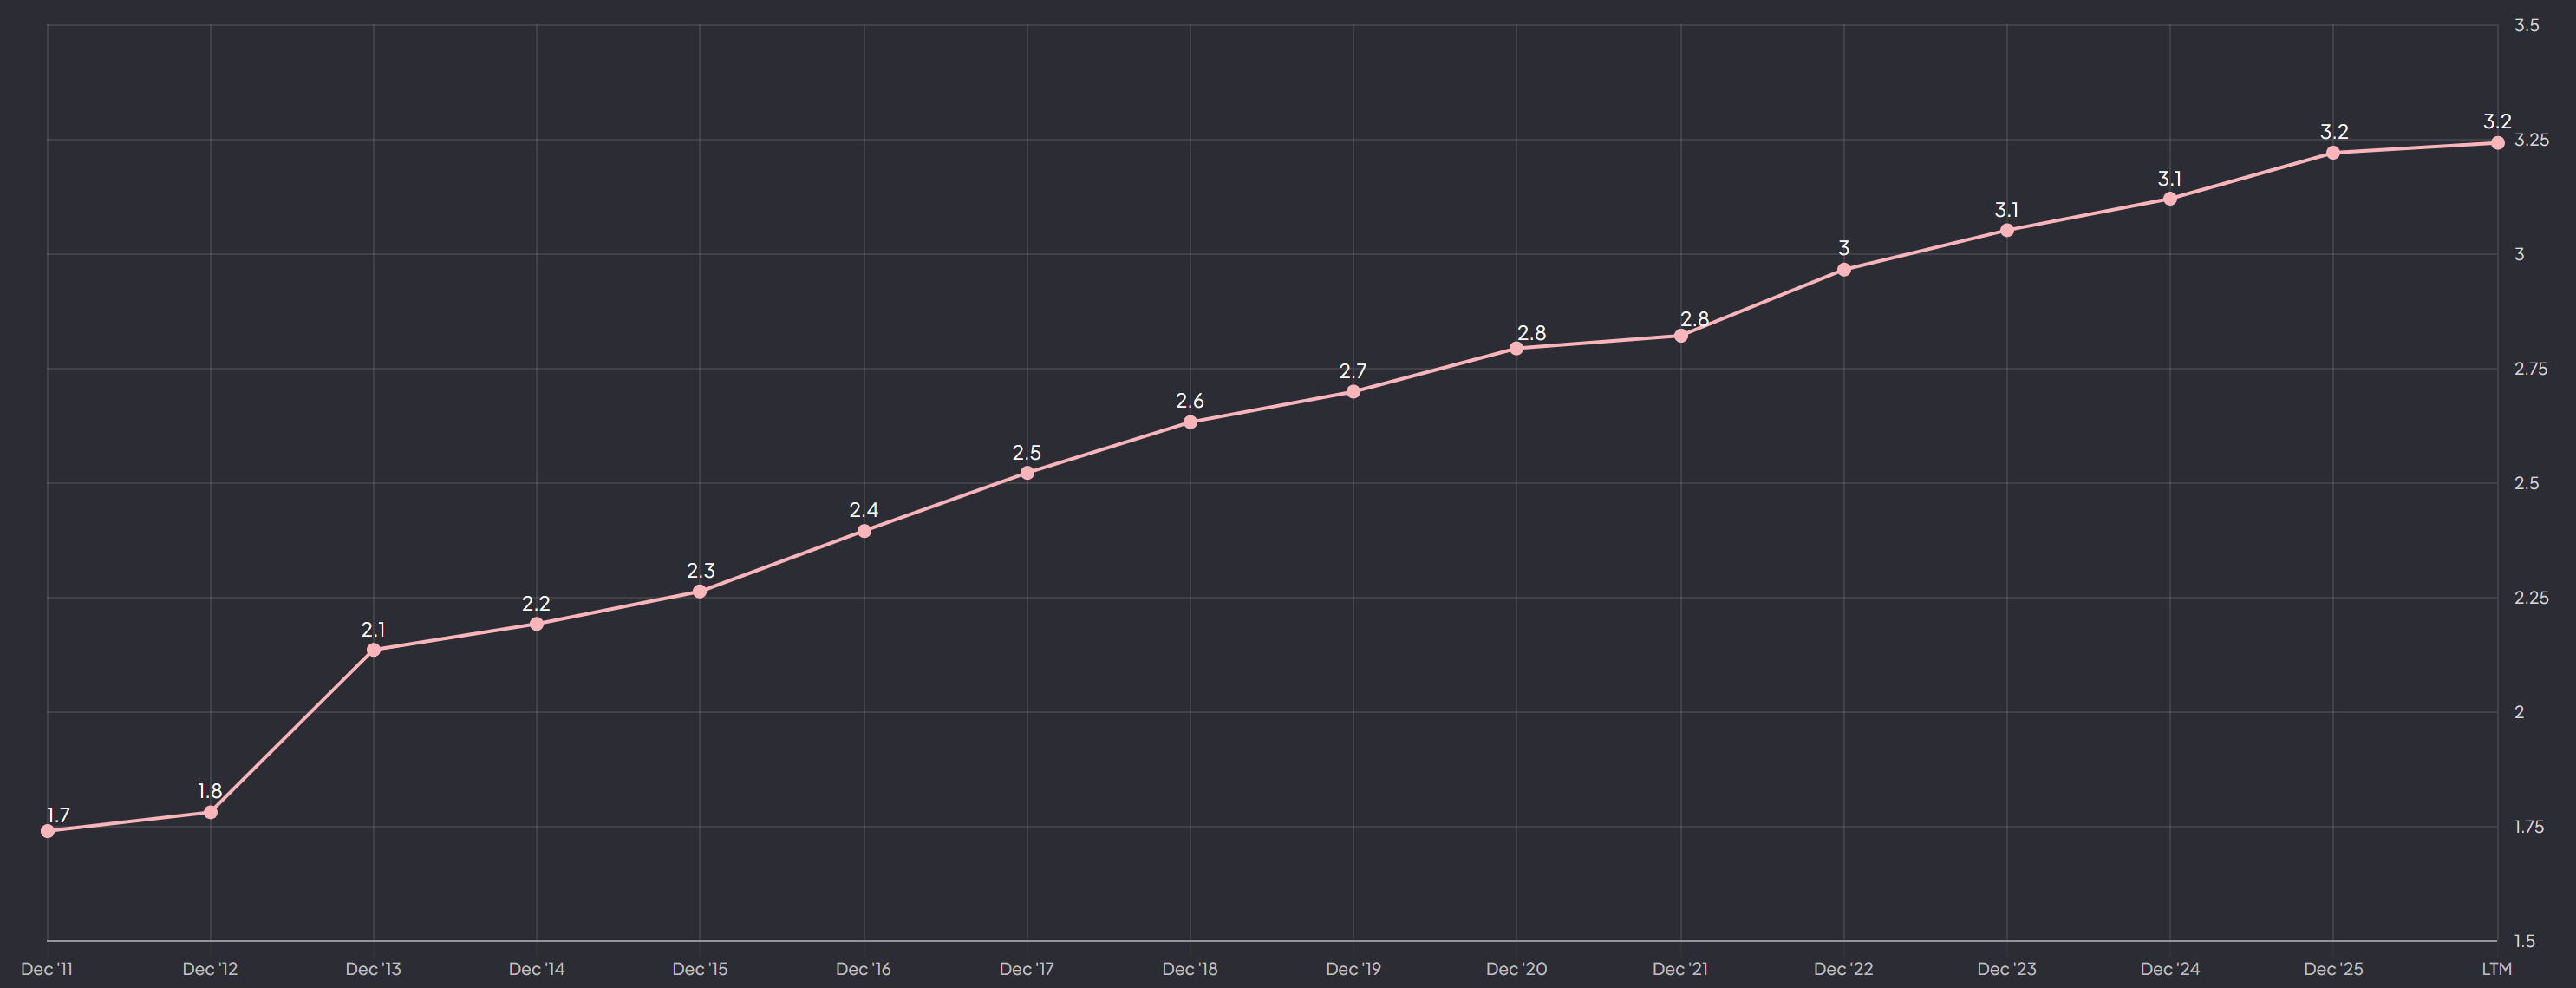
Currently, Realty Income is paying a dividend of $3.25 per share.
From this, we can also project the next year dividend payment following three scenarios, explained on the previous section:
Bad Scenario
Dividend Growth: 1.00%
Next Year Dividend Payment: $3.28
Base Scenario
Dividend Growth: 2.50%
Next Year Dividend Payment: $3.33
Good Scenario
Dividend Growth: 4.00%
Next Year Dividend Payment: $3.38
This values for the next year dividend will be used later during the dividend discount model method.
Cost of Equity
I’ve used the latest quarterly and annual report of the company, the 10-Year US bonds as the risk free rate and revenue geographic exposure to come up with its cost of capital, cost of debt and cost of equity. Also, given the fact that Moody’s provided a rating for the company I used it as the debt rating.
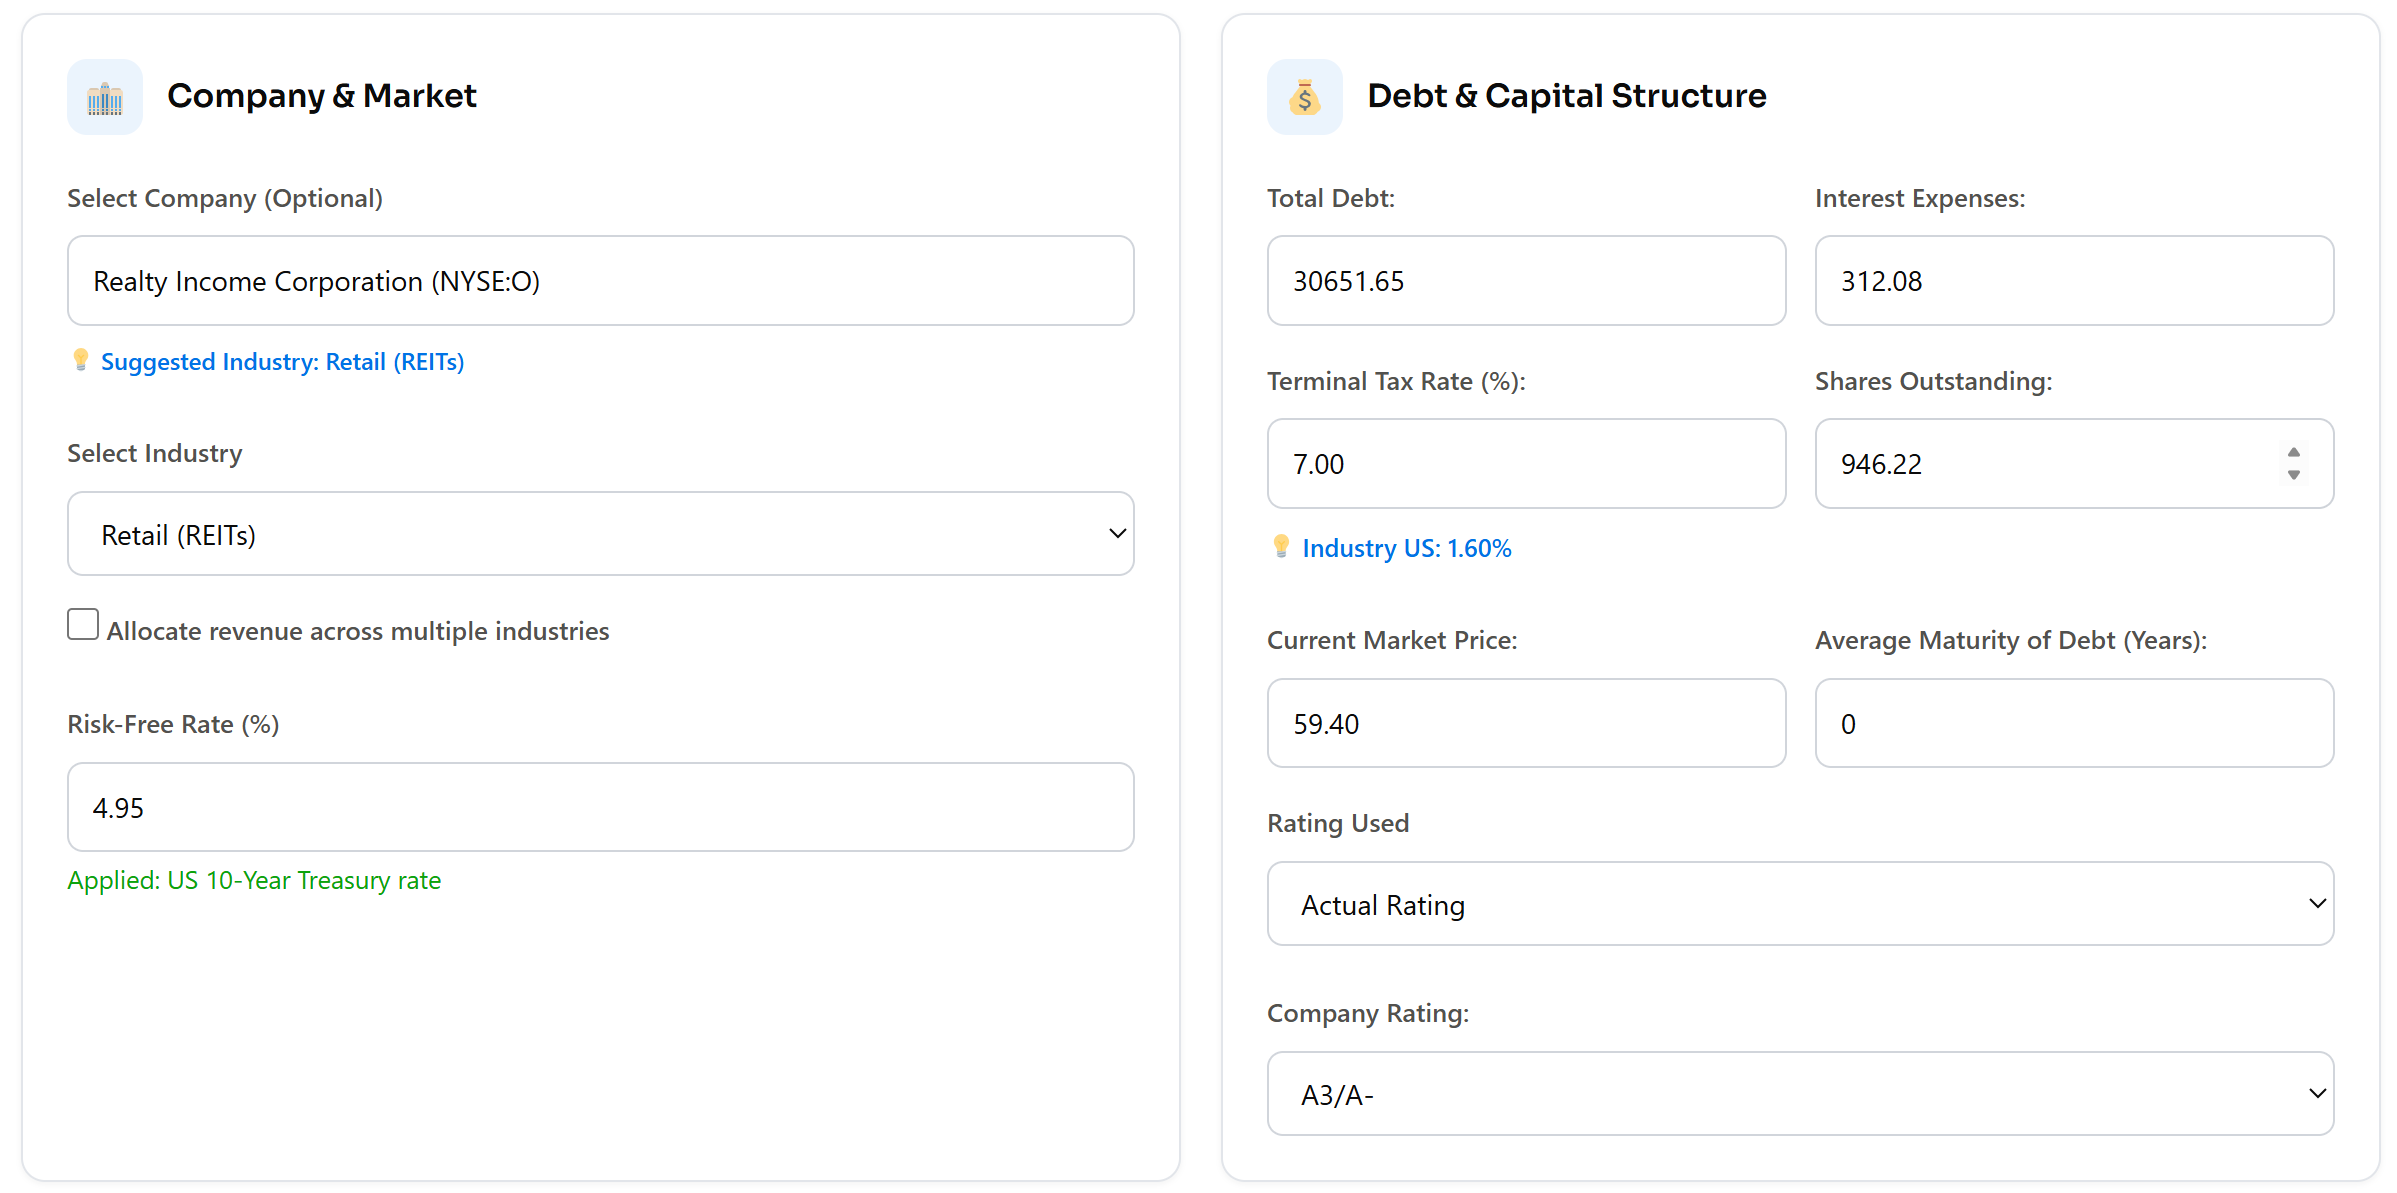
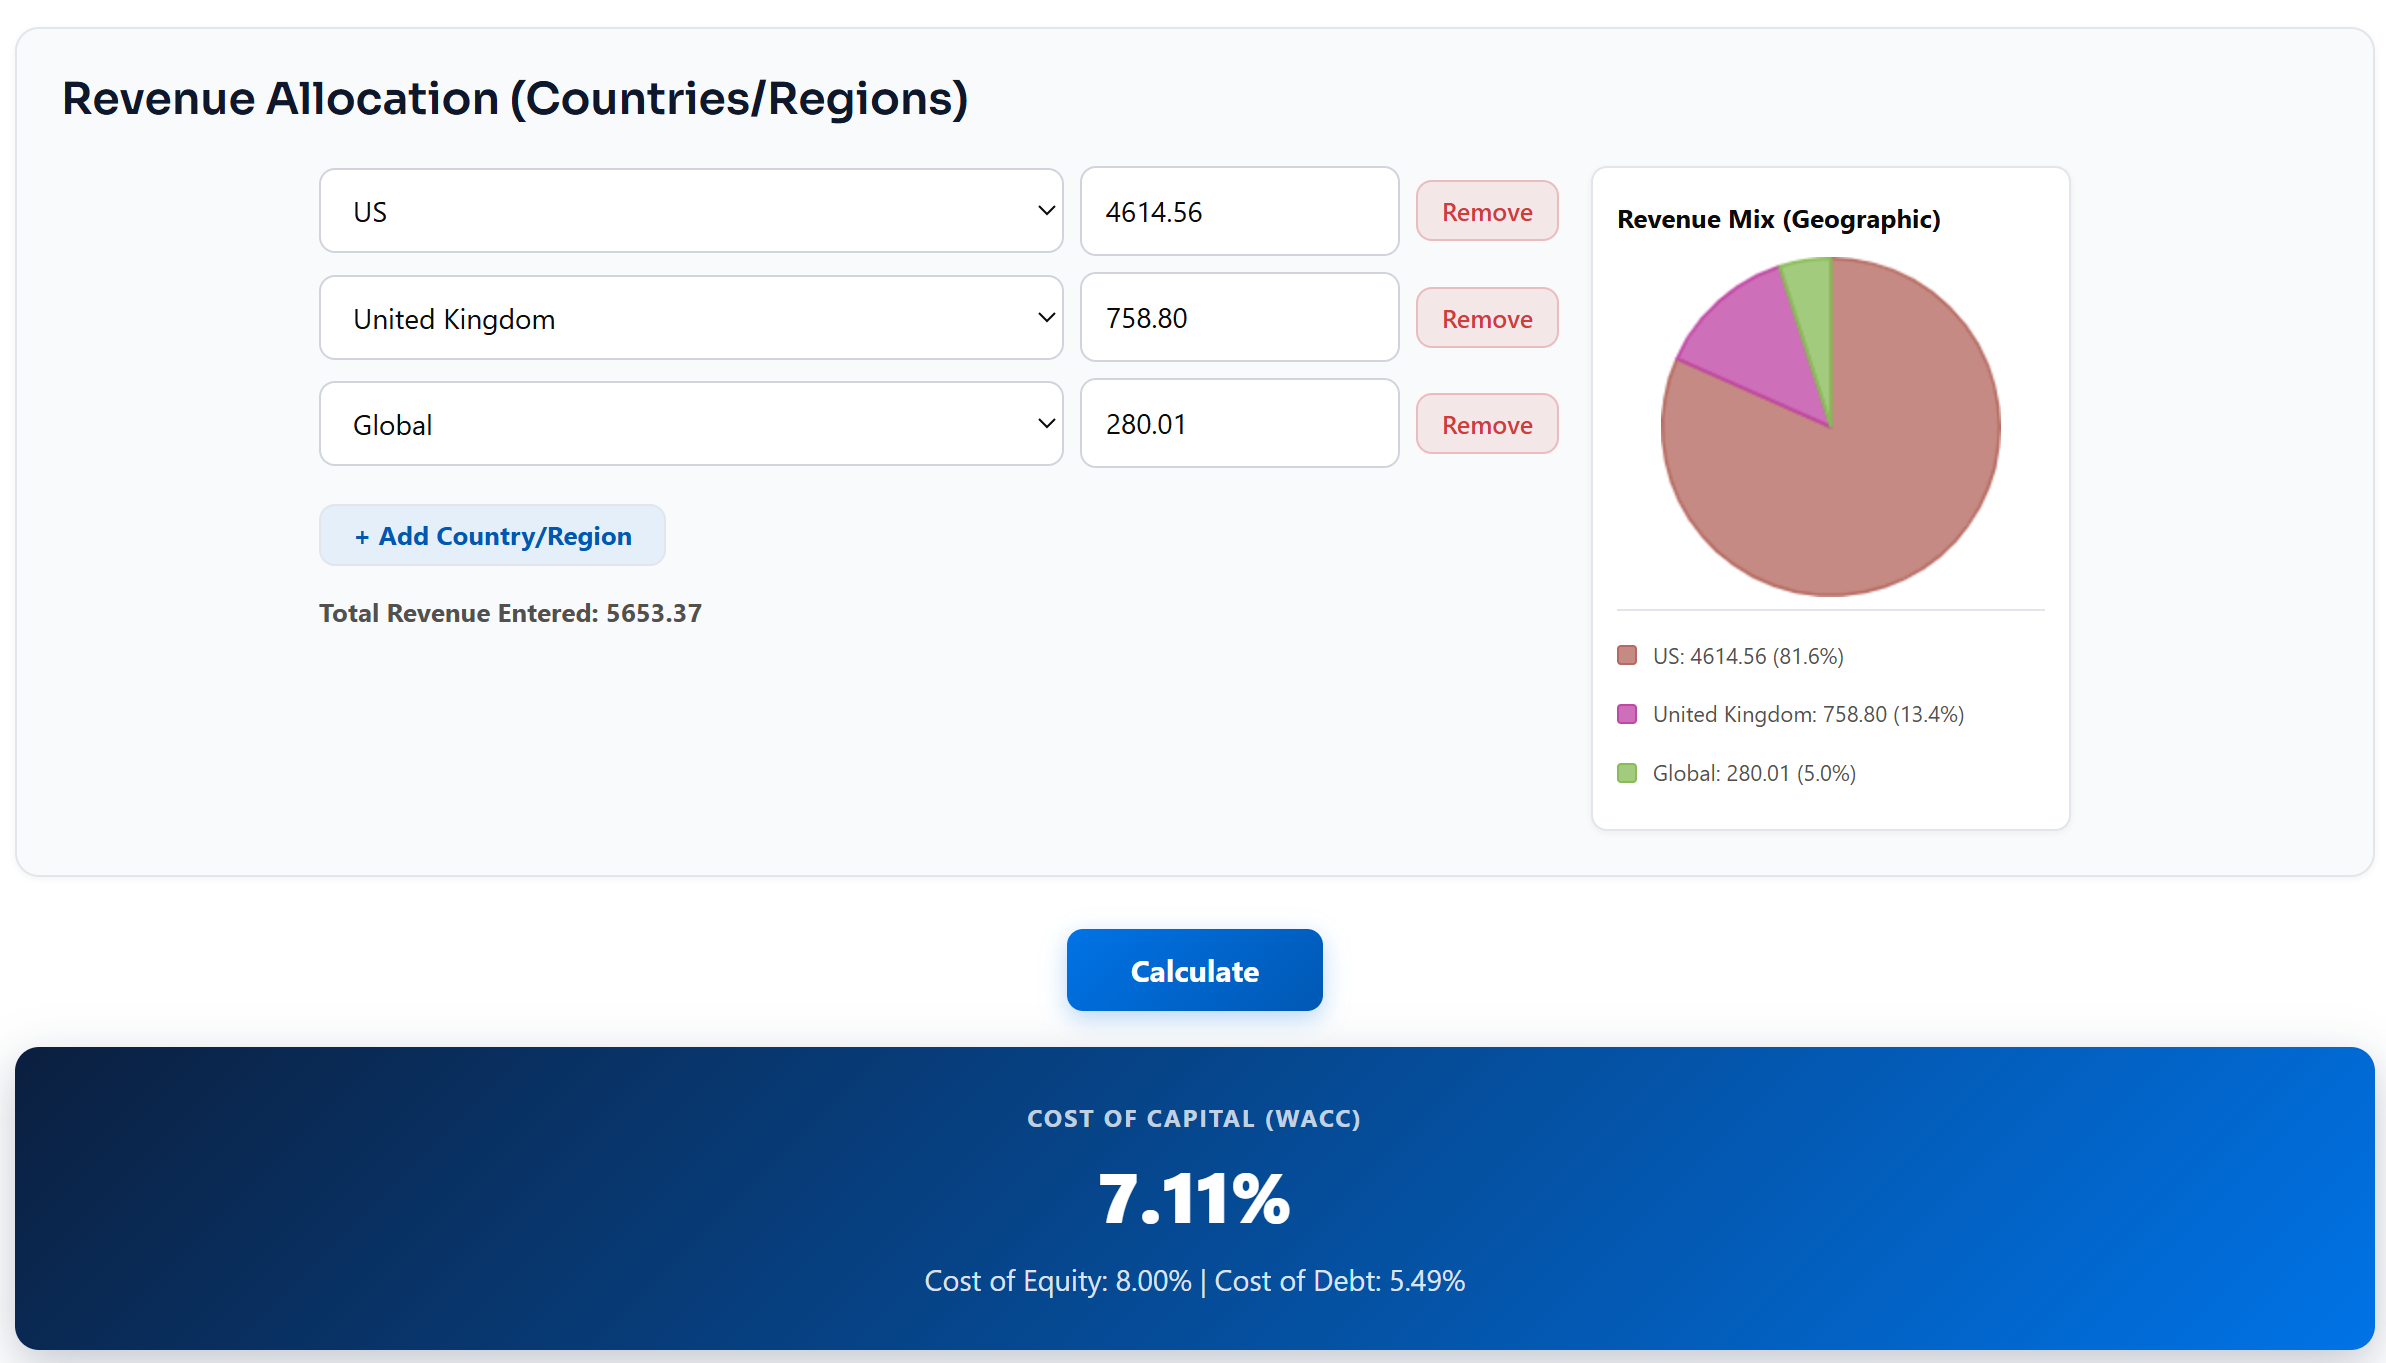
Cost of Equity: 8.00%.
This value will be used later as a discount rate in the Dividend Discount Model valuation method. Here we will use Cost of Equity instead of Cost of Capital because dividends are paid only to equity holders. While using Cost of Capital on a Discounted Cash Flow (DCF) method for example we are checking for cash flows paid to both equity and debt holders.
Please feel free to come up with your own values by using the tool I’ve used: Cost of Capital – The Fair Value Journal. It is and will ever be completely free 🙂
Also, keep in mind that the average cost of equity in the US for a company similar to Realty Income in the Retail (REITs) industry is ~6.72%.
Later, we will explore some variability over these values by using a Monte Carlo simulation, exploring for example if the company converges its cost of equity to industry values ~6.72% or even if it has a higher cost of equity around ~9.00%.
Dividend Discount Model – Stable Growth (Weight: 60%)
Given my base assumptions and estimations above, we can now estimate the fair value for the company using a DDM – Stable Growth model:
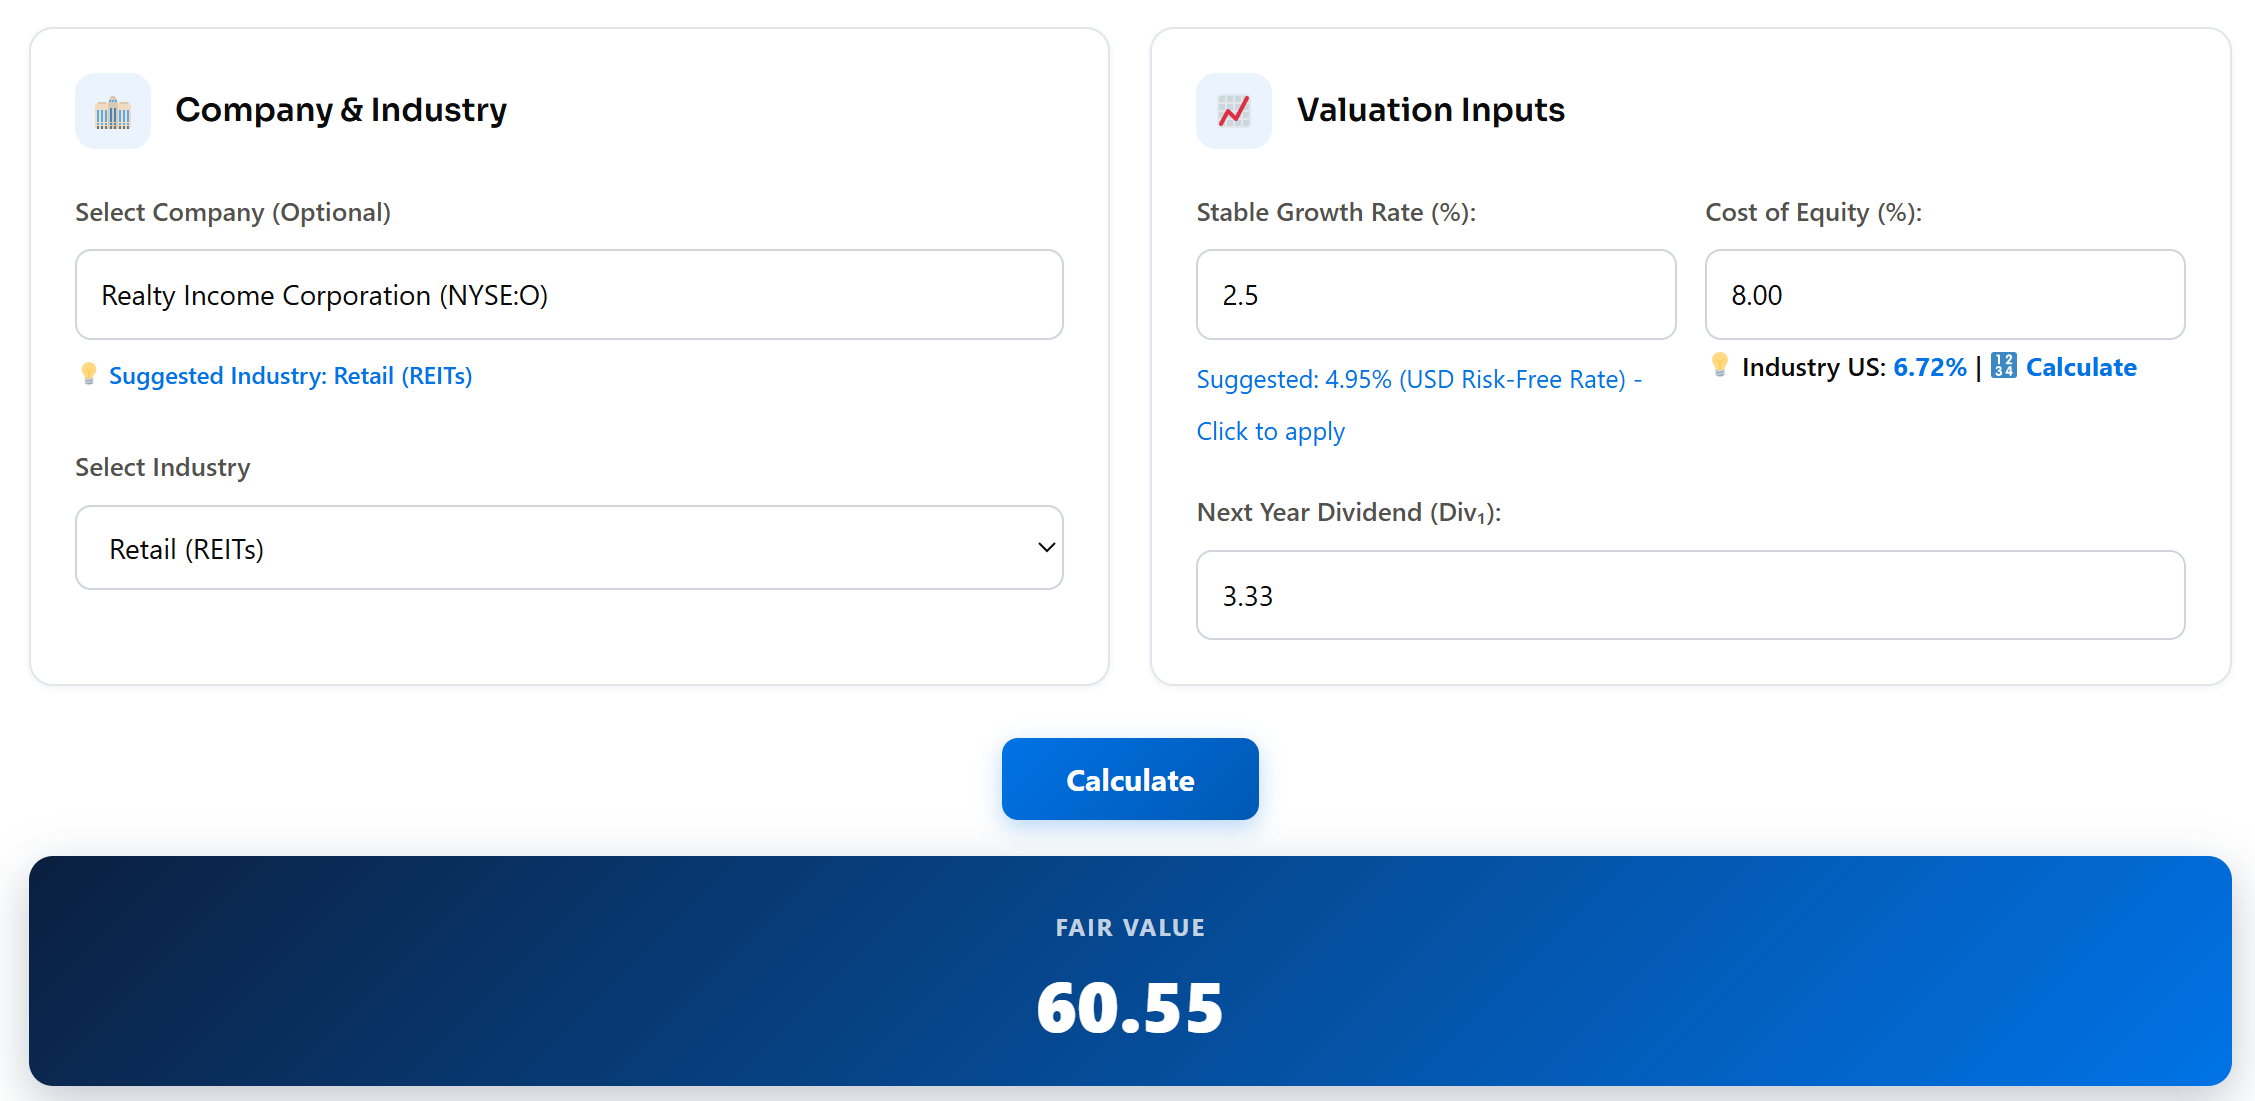
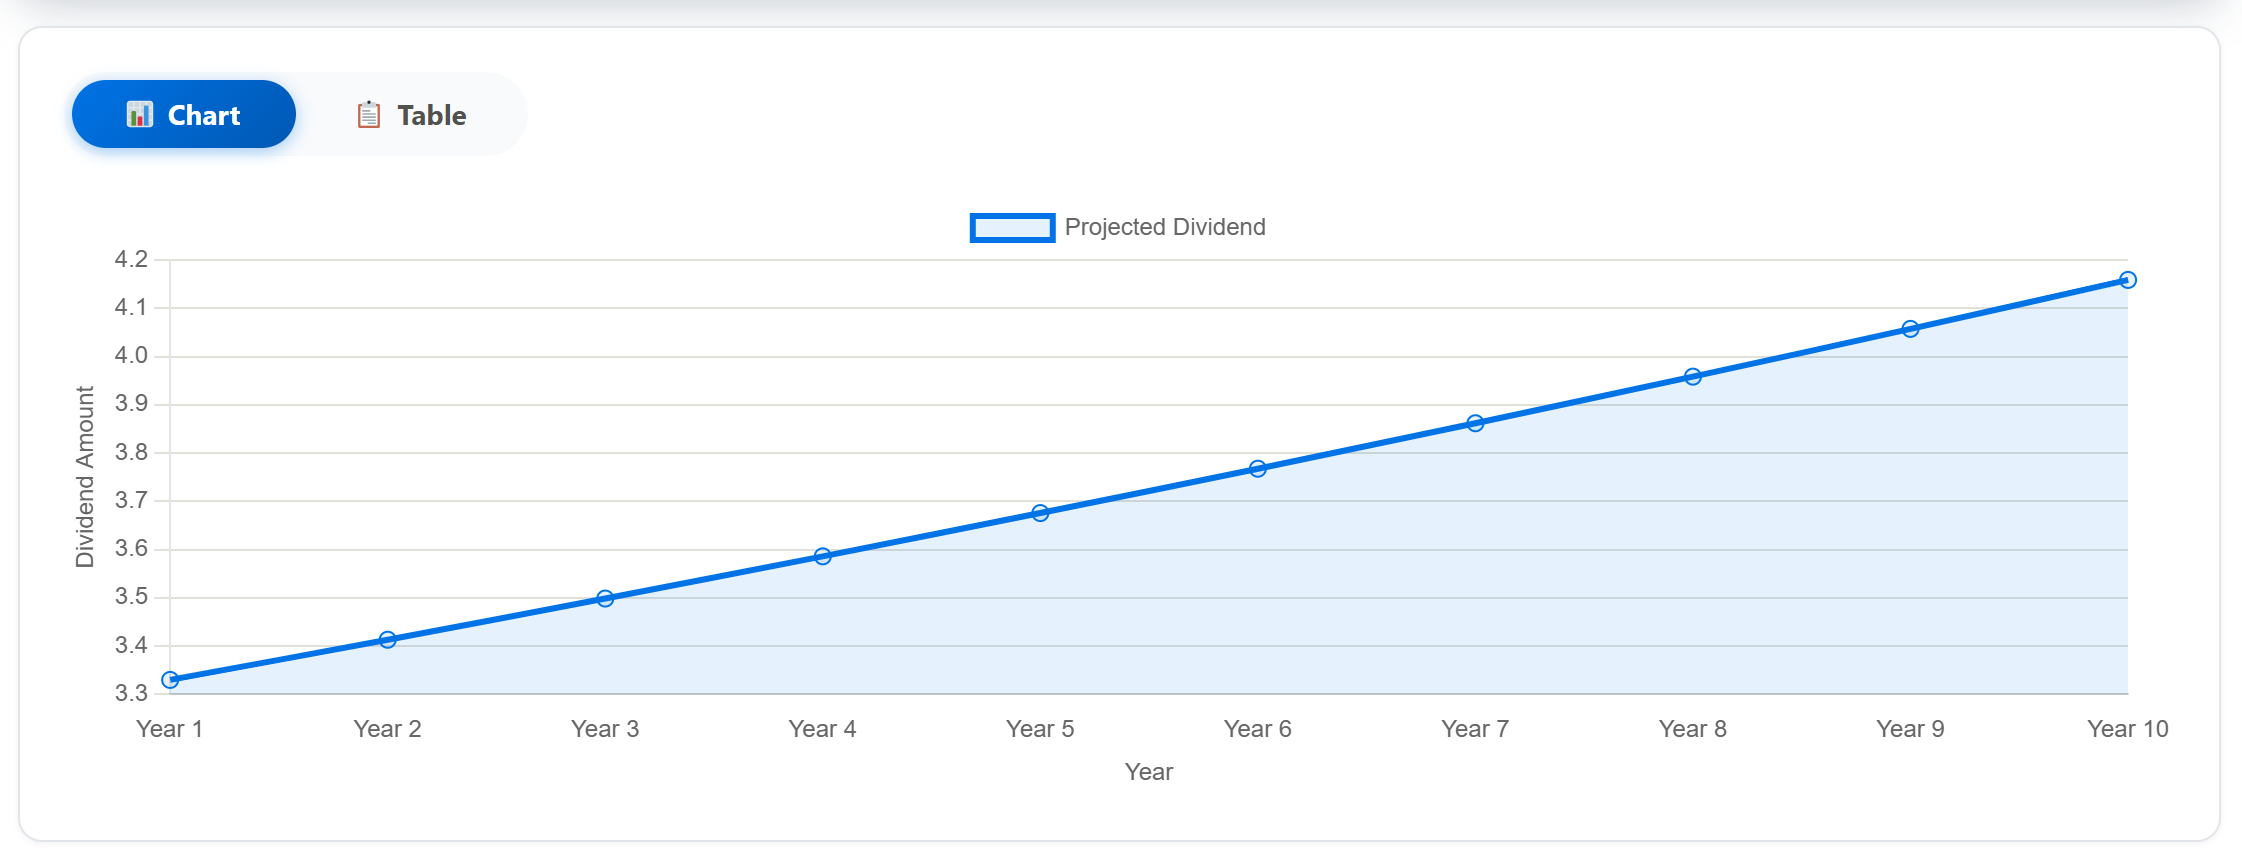
This valuation method gives us an estimated fair value of $60.55 for Realty Income.
Something that we can also do now is to play around with Monte Carlo simulations. What this will allow us to do is to simulate multiple DDM valuations with pre-defined ranges for each of the inputs. Each simulation will randomize the inputs between these pre-defined values. For this I also used my assumptions and the range explained on during those sections.
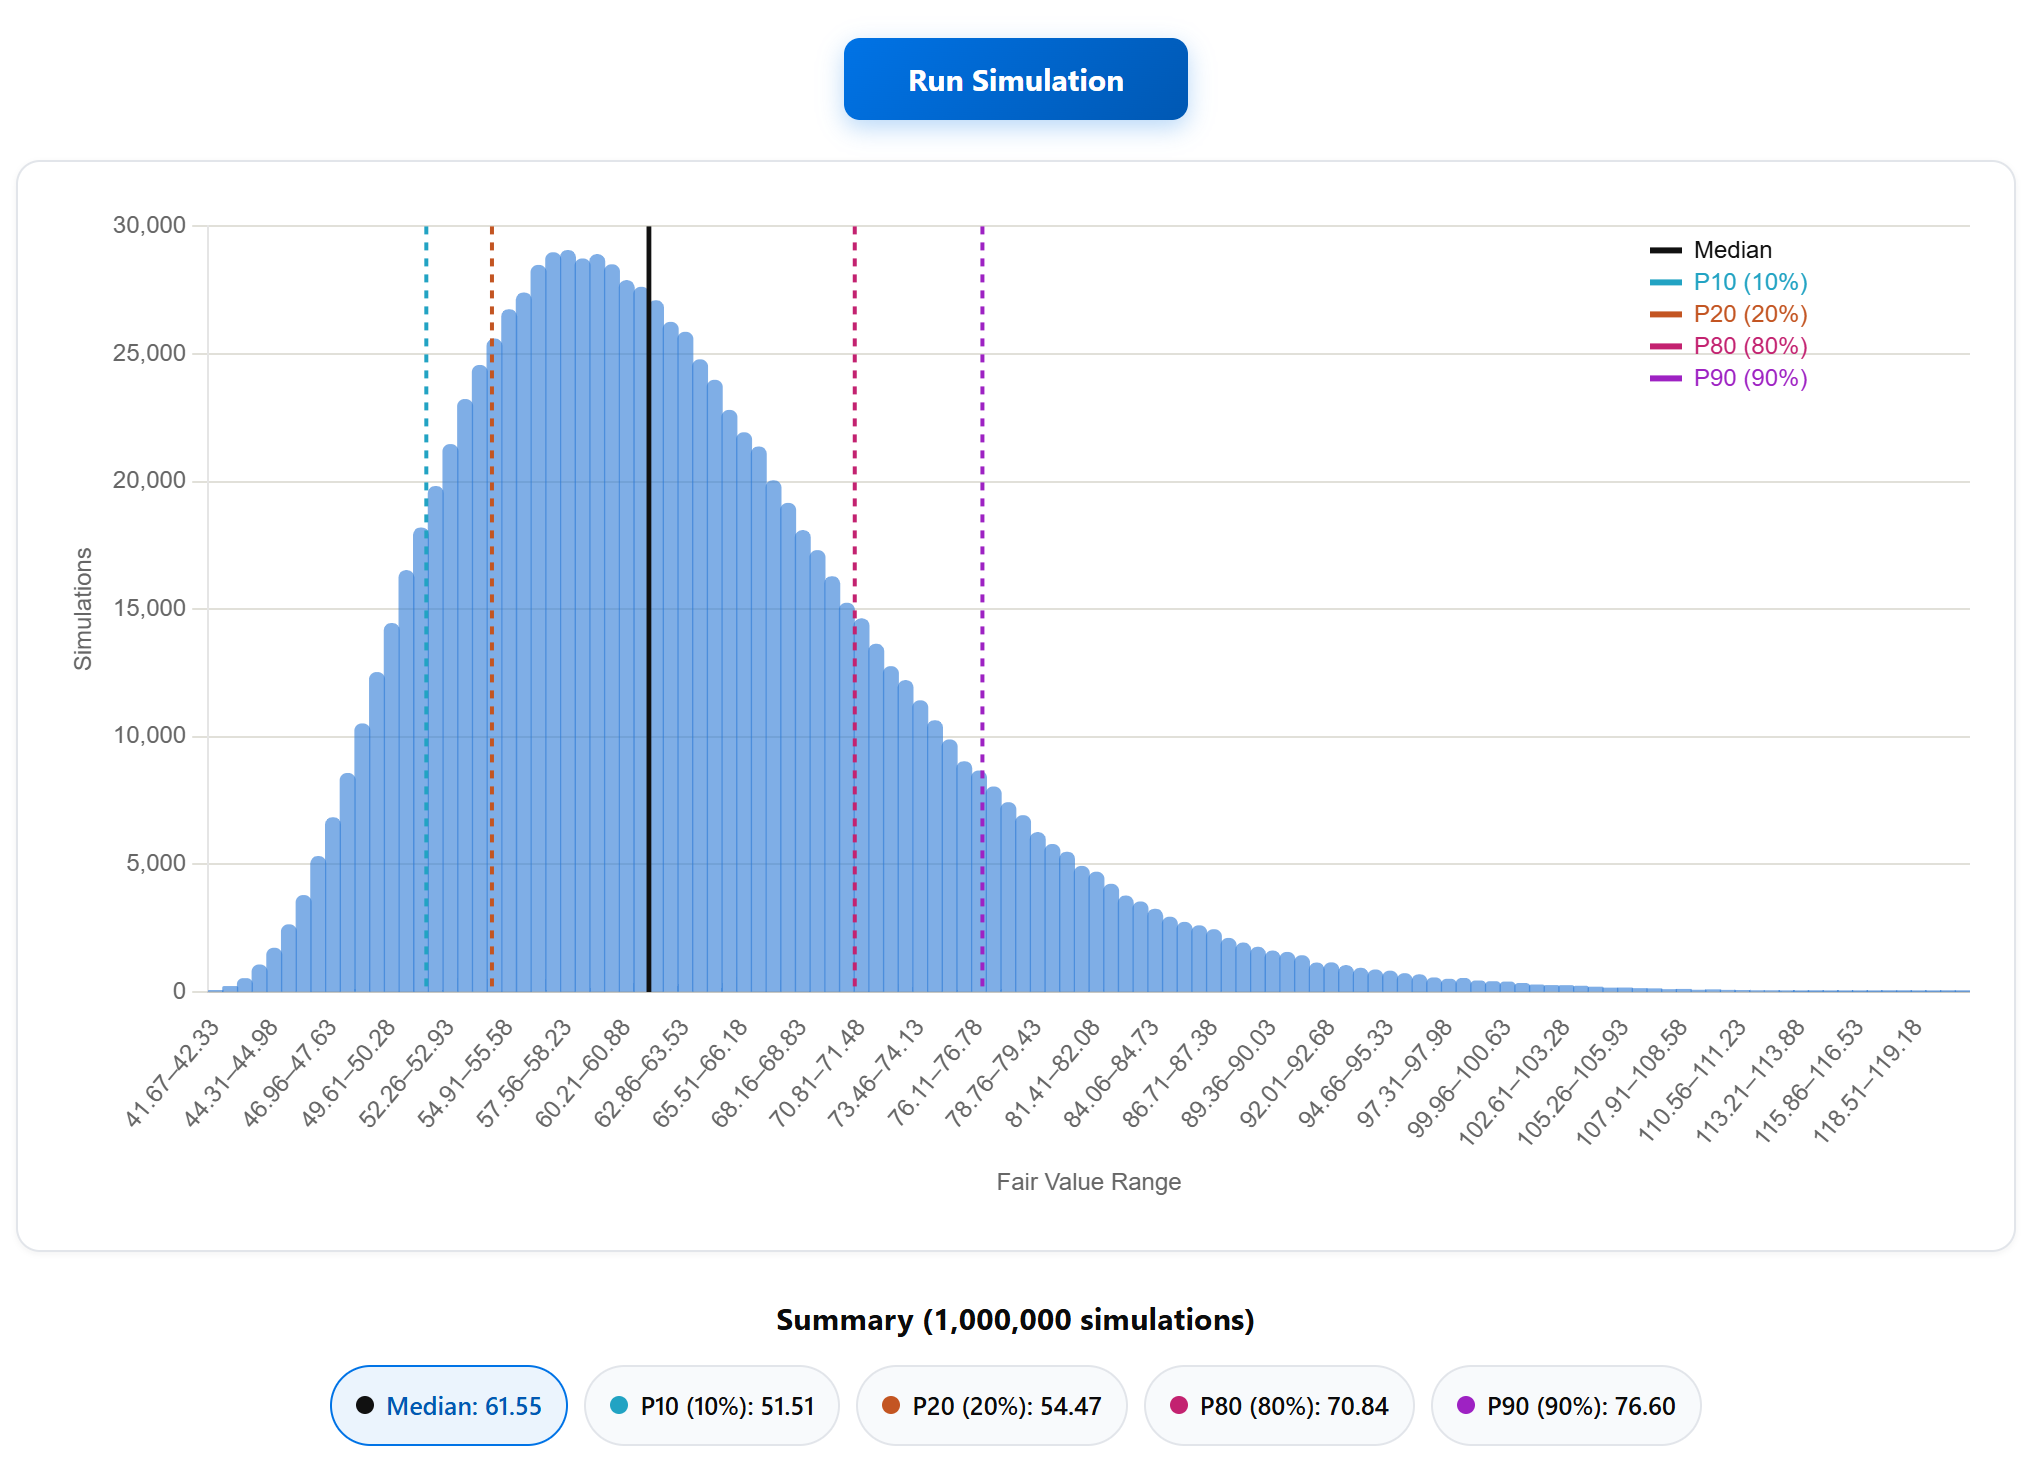
From this randomized simulations, over the lower and higher range assumptions explained before, we can objectively say that Realty Income seems to be fairly valued given that its current price of $59.40 is around the median of $61.55. We can then extrapolate that there’s ~50% probability of Realty Income being undervalued but also overvalued.
Please be free, as before, to fill in your own values. Make the valuation your own and do yourself a DDM – Stable Growth valuation using your own assumptions: DDM (Stable) – The Fair Value Journal
Historical Dividend Yield (Weight: 40%)
Now to sanity check the valuation above, let’s also compare how much % is the company paying in dividends against its stock price (dividend yield).
Below is the last ~15 years of annual dividend yields for Realty Income:
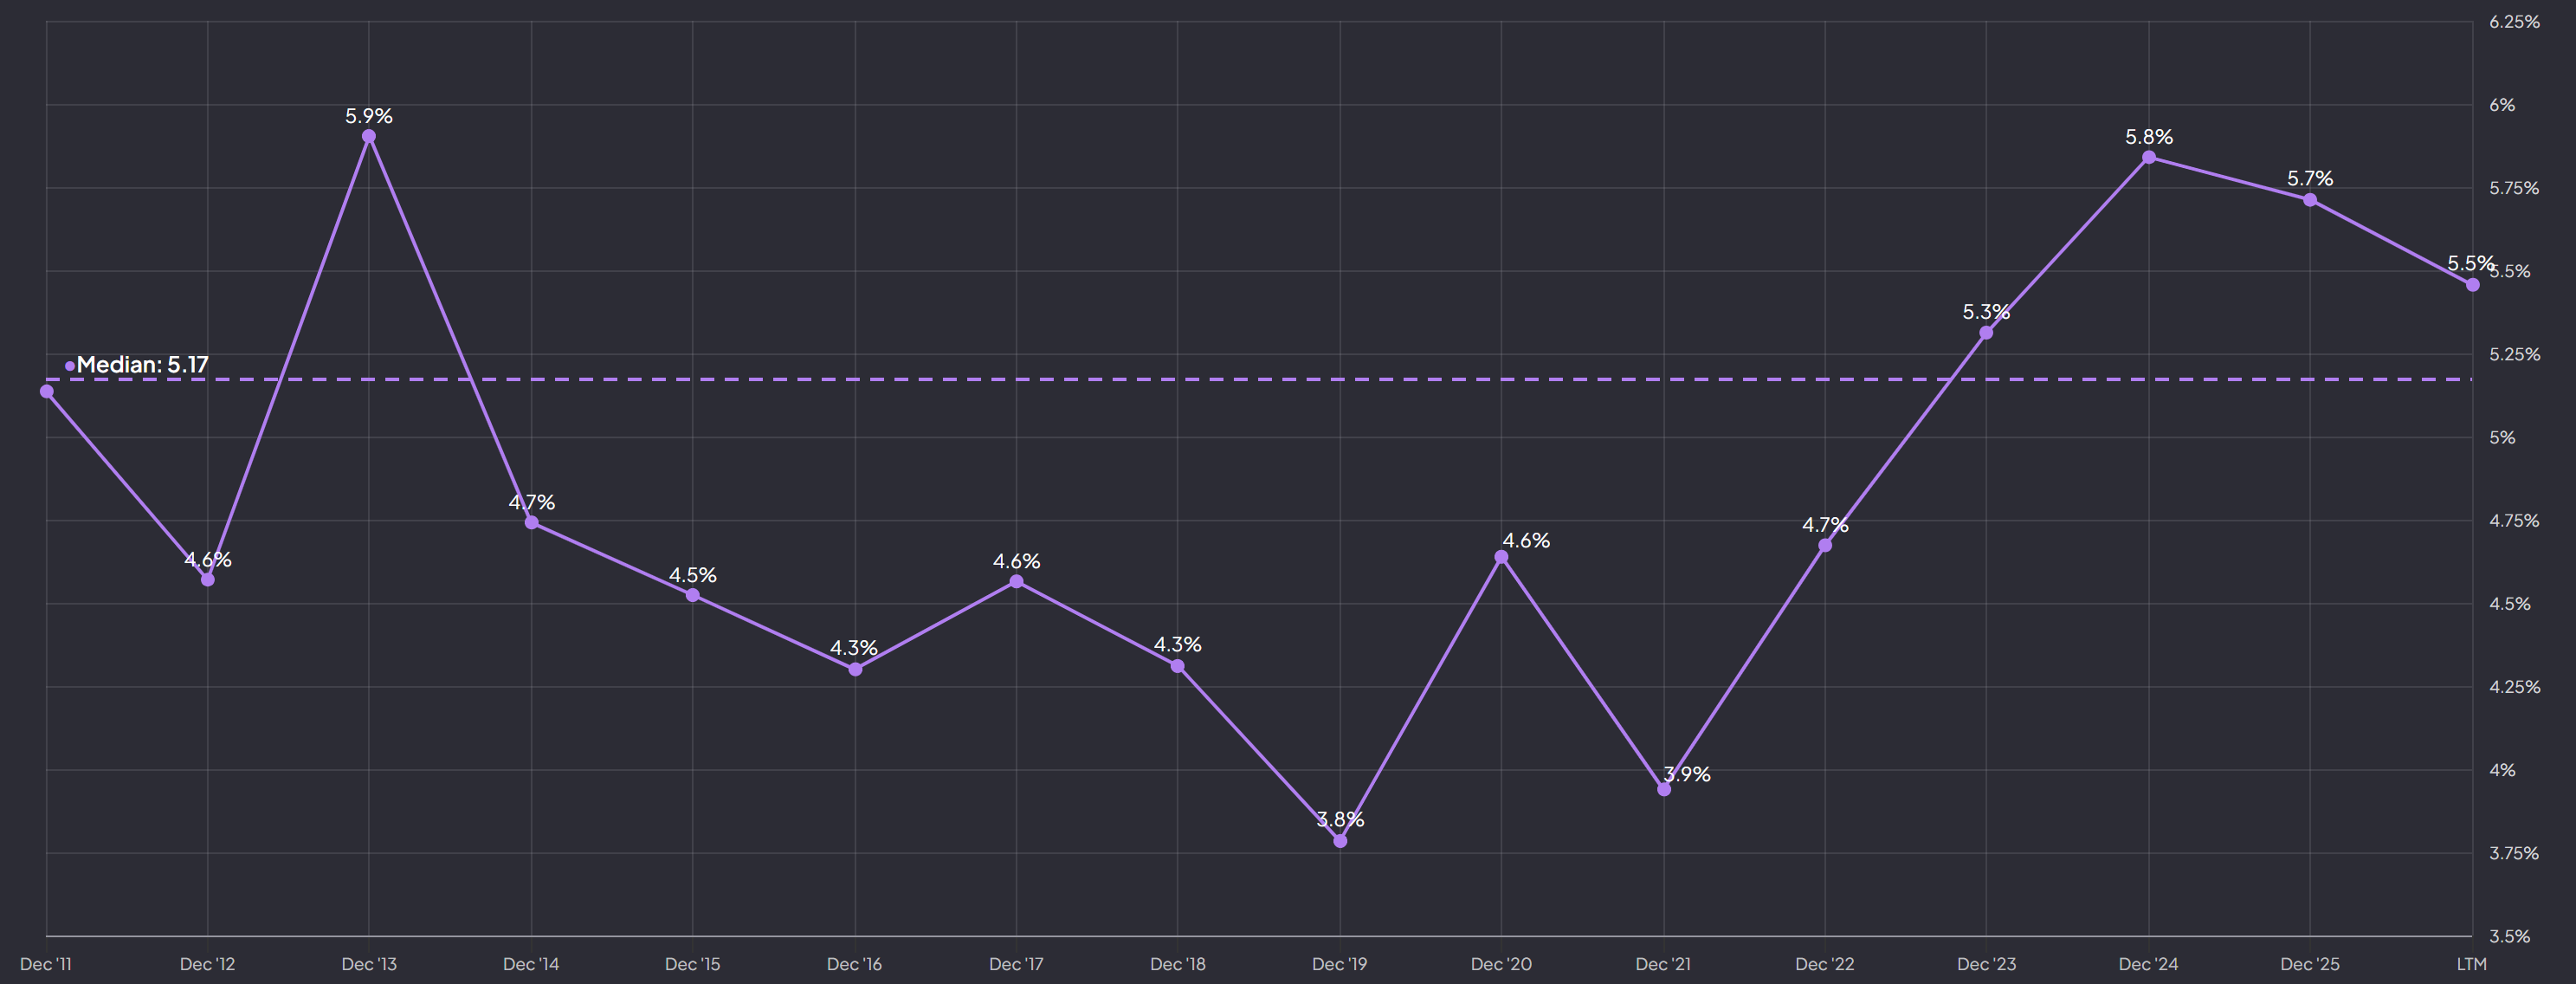
As you can see the company seems to be paying a little above its historical median. This may mean the company is undervalued, given that you’re getting more in dividends now, for the same stock price.
We can calculate its difference to the historical median and that would give us a 6.00% undervaluation. If we assume a reversion to the median, the company fair value should be $62.96.
We can add and subtract 10% and 20% to get the BUY and SELL with low and high confidence:
Fair Value: $62.96
BUY – Low Confidence (20% margin of safety): $50.37
BUY – High Confidence (10% margin of safety): $56.66
SELL – Low Confidence (10% margin of safety): $69.26
SELL – High Confidence (20% margin of safety): $75.55
Feel free to choose your own margin of safety.
From this historical method, we can see that the company is fairly valued or at most a little undervalued.
✍️Summary
Now that we did all the heavy work, let’s take all of the above and come up with the company weighted average fair value.
I basically take each valuation method used and given my confidence on the company apply a 20% or 10% discount (when to buy) and addition (when to sell) or use the Monte Carlo P10, P20, P80 and P90 values:
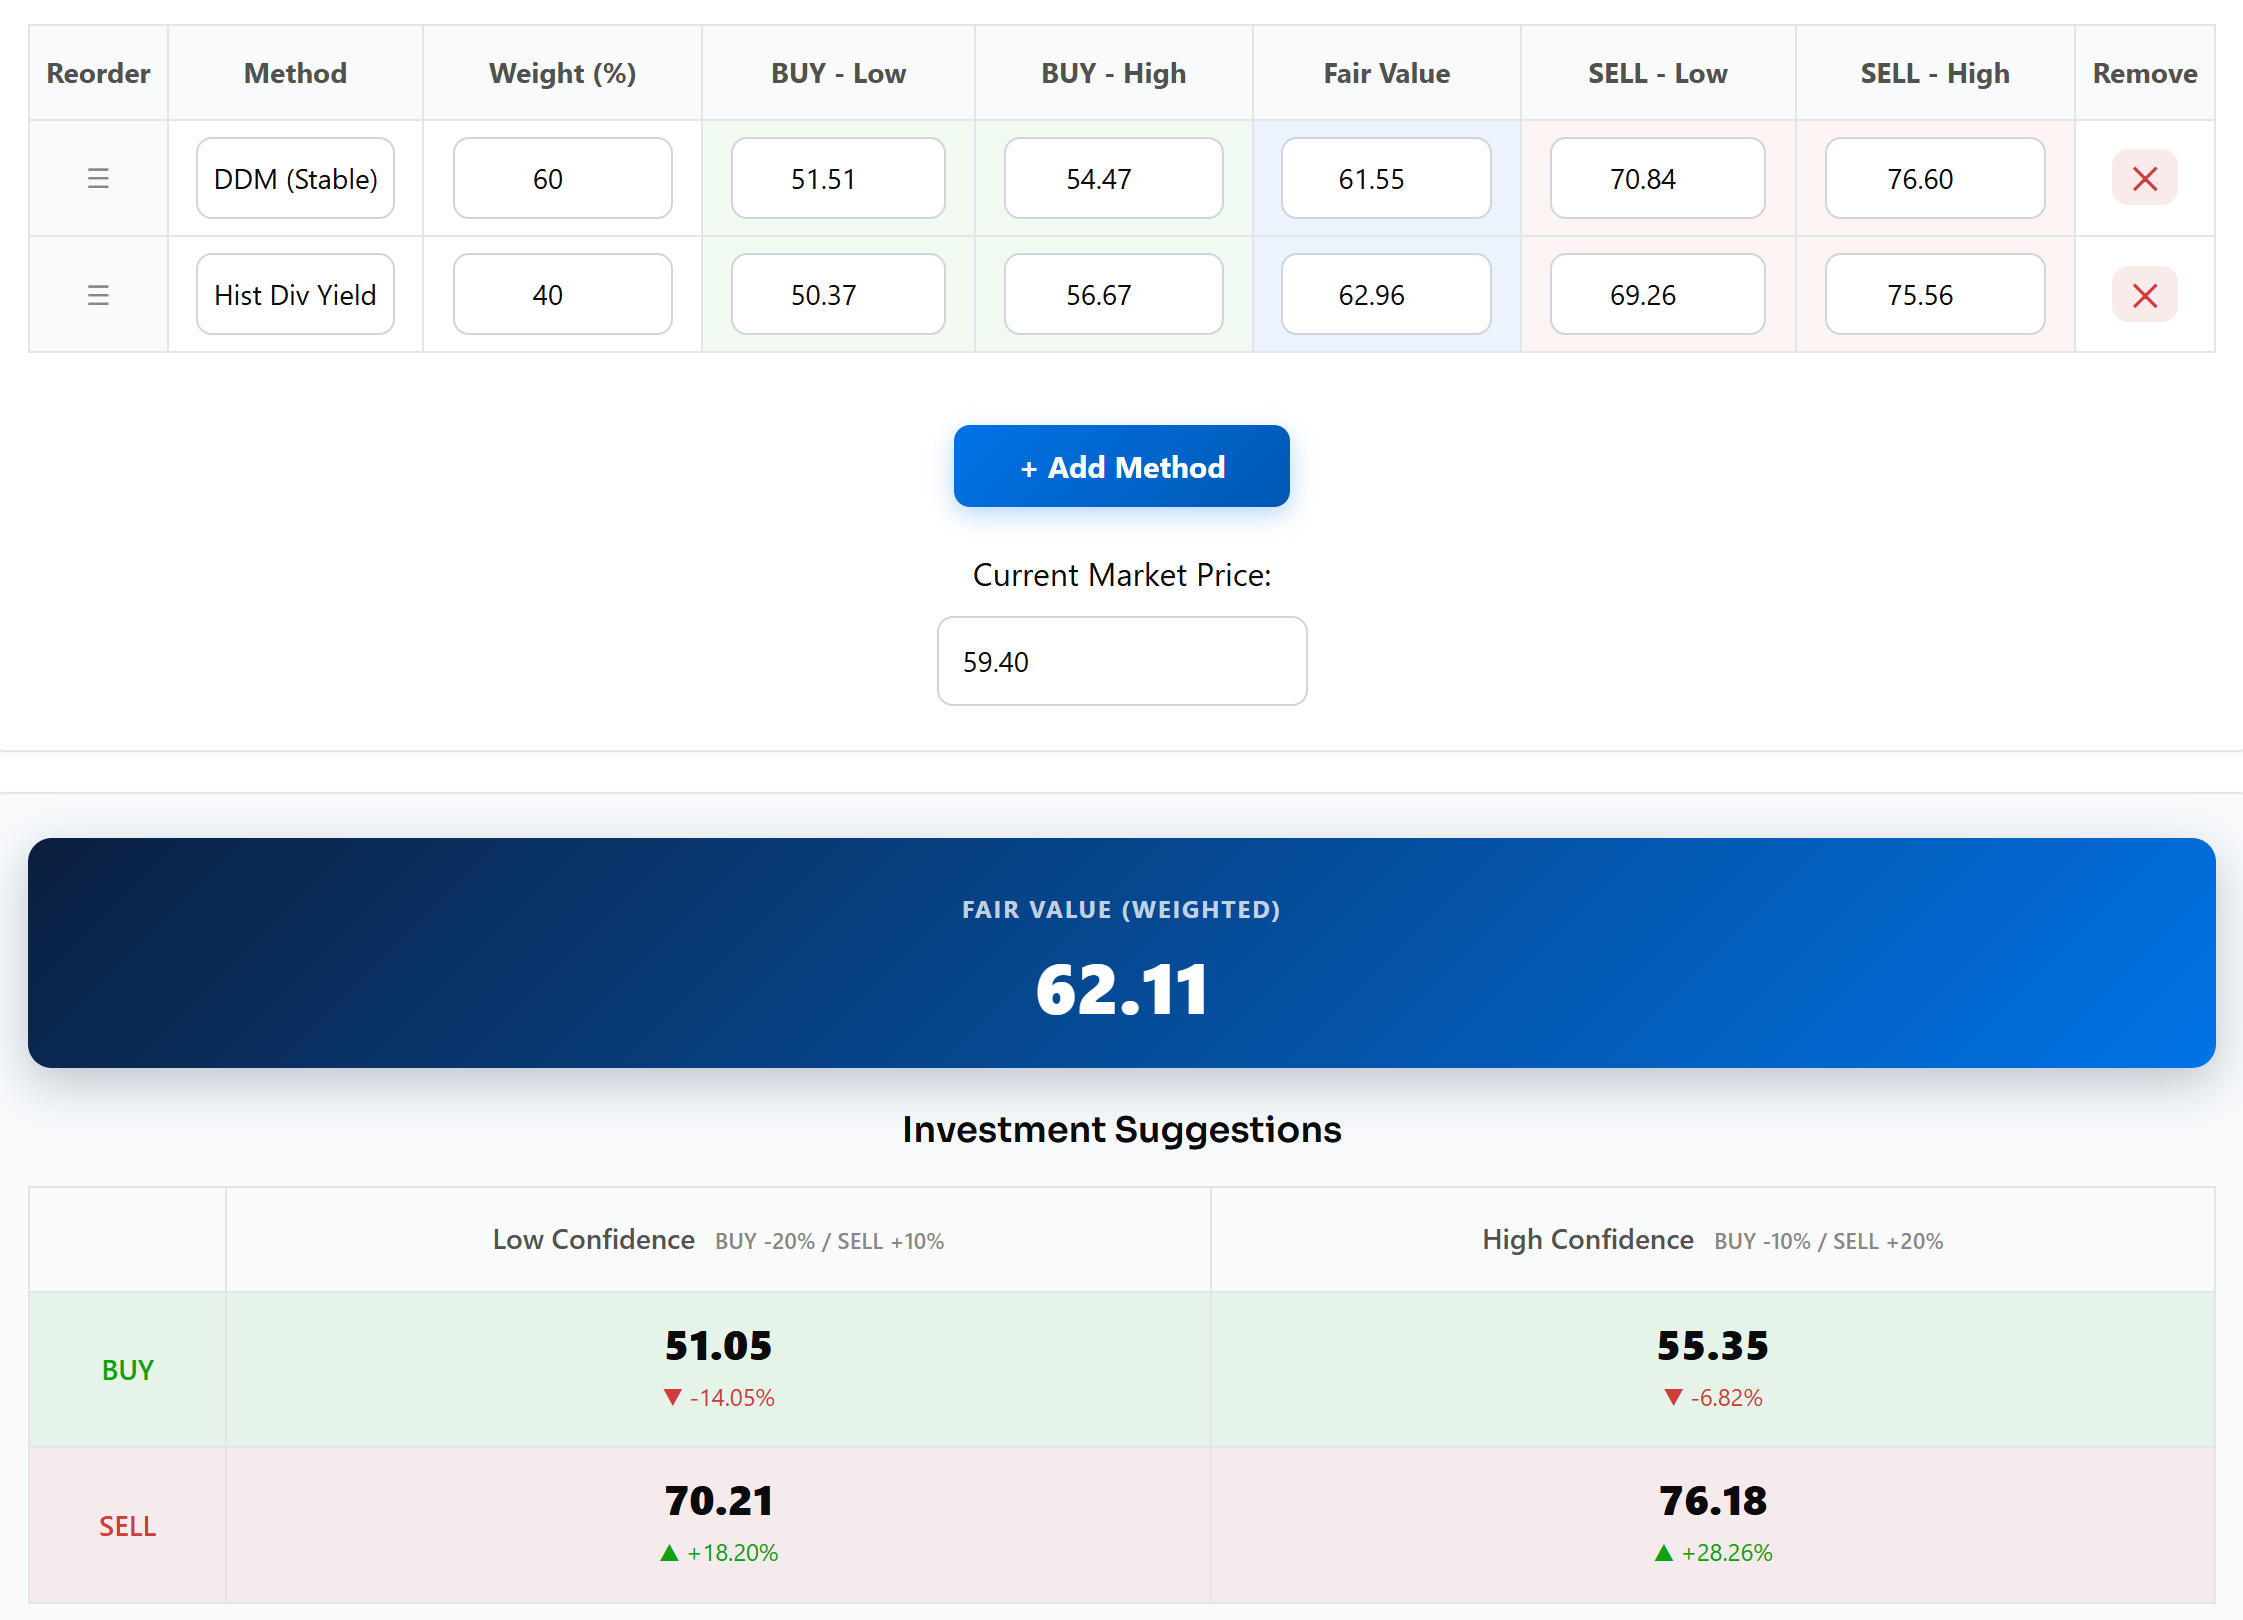
Feel free to choose your own values, but for me I would start adding again or initiating a position in Realty Income below the 55.35 dollars mark, because this is a great defensive stock and a reliable source of dividend income.
Please, as always, remember that the fair value estimate has a 100% probability of being wrong and it will never be a precise number, even if it has decimals next to it 😮
Overall it seems Realty Income is fairly valued or at most a little undervalued at its current market price.
Fair Value: $62.11