🏗️ Business Overview
Founded in 1925, Caterpillar is a global leader in construction and mining equipment, diesel and natural gas engines, and industrial gas turbines. Operating across over 190 countries, the company serves industries from infrastructure and mining to energy and transportation.
Its strong dealer network, brand reputation, and broad product portfolio give Caterpillar a durable competitive edge. The company benefits from long-term demand for infrastructure development, resource extraction, and energy transition projects.
With robust margins, recurring aftermarket revenue, and disciplined capital allocation, Caterpillar remains well-positioned to deliver steady growth and shareholder returns through economic cycles.
💵Revenue Exposure & Diversification
The revenues are geographically diversified over the following geographic segments:
- North America: 53.08%
- 1-Year Revenue Growth = -0.60% (5Y CAGR: 5.93%)
- Europe, Africa and Middle East: 19.00%
- 1-Year Revenue Growth = -9.92% (5Y CAGR: 1.88%)
- Asia / Pacific: 17.57%
- 1-Year Revenue Growth = -6.01% (5Y CAGR: -1.18%)
- Latin America: 10.35%
- 1-Year Revenue Growth = 0.65% (5Y CAGR: 7.33%)
Its also diversified across several business segments:
- Energy & Transportation: 42.23%
- 1-Year Revenue Growth = 3.05% (5Y CAGR: 9.31%)
- Estimated Operating Margin: ~15-20%
- Construction Industries: 36.99%
- 1-Year Revenue Growth = -7.16% (5Y CAGR: 2.45%)
- Estimated Operating Margin: ~20-25%
- Resource Industries: 16.83%
- 1-Year Revenue Growth = -8.79% (5Y CAGR: 4.77%)
- Estimated Operating Margin: ~16-21%
- Financial Products Segment: 3.95%
- 1-Year Revenue Growth = 7.08% (5Y CAGR: 3.37%)
- Estimated Operating Margin: ~18-23%
💬Caterpillar’s Narrative
“While economic cycles and commodity price swings can impact Caterpillar’s short-term performance, its long-term demand drivers—global infrastructure, mining, and energy needs—remain solid.”
“Competitive pressures exist, but Caterpillar’s brand strength, dealer network, and extensive product support position it to maintain industry leadership and capture opportunities from megatrends like urbanization and energy transition.”
🎯Key Insights & Assumptions
- Revenue Growth: 5-Year (CAGR): 3.79% | Last Year: -3.36%
- Expected to slightly decrease or not grow during the next year and then projected to stabilize around ~4-5% growth.
- Free Cash Flow Growth: 5-Year (CAGR): 15.78% | Last Year: -9.94%
- Projected to be stabilized around ~5-10%.
- Operating Margin: 5-Year Avg: 16.37% | Last Year: 20.27%
- Margins improved during the last couple of years and are expected to be maintained around ~20%.
- Return on Invested Capital (ROIC): 5-Year Avg: 16.53% | Last Year: 20.46%
- Expected to be maintained around ~15-20%.
- Dividend Growth: 10-Year (CAGR): 7.10% | Last Year: 8.43%
- Given the healthy payout ratio, it is expected that Caterpillar will be able to maintain a ~7-10% dividend growth during the next couple of years.
- Dividend Payout Ratio: 5-Year Avg: 39.98% | Last Year: 25.08%
- Expected to be stabilized around ~30-35%.
- Number of Shares Growth: 5-Year (CAGR): -2.77% | Last Year: -4.29%
- Projected to be around the -3% given its historical share buyback rate.
📈Business Valuation
To assess Caterpillar’s intrinsic value, we will use multiple valuation methods:
- Discounted Cash Flow (DCF) – Projects free cash flows over 10 years and discounts them to present value. Given its focus on cash generation and fundamentals, this method carries the most weight.
- EPS Growth Projections – Uses EPS growth forecasts over 5 years combined with scenario-based P/E multiples.
- Historical P/E Ratio – Compares the current P/E to its 5-year historical median.
The DCF model will carry the greatest weight in our valuation, as it directly reflects Caterpillar’s cash flow potential grounded in our previous assumptions and narrative about revenue growth and operating margins.
Next, the EPS Growth method will be weighted with less emphasis than the DCF. This is because EPS can sometimes be influenced by accounting or share buybacks, potentially distorting the company’s true earning power.
Finally, the Historical P/E Ratio method will have the least weight. This method assume a reversion to historical averages, which may not materialize because companies like Caterpillar are cyclical, meaning it becomes meaningless to compare different business cycles against each other. Therefore, while useful as reference points, these reversion-based methods should be treated cautiously.
Discounted Cash Flow (Weight: 60%)
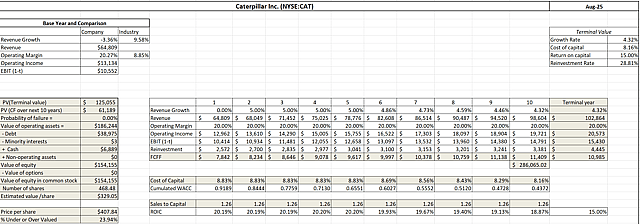
📌 Key Assumptions
- Revenue Growth (CAGR) is estimated to be 0% for the next year, ~5% for the next 5 years and then decrease gradually to around ~4.32% (risk-free rate using 10-YR U.S. bond yield).
- Operating Margin maintained around ~20% given its historical and current averages.
- Cost Of Capital is estimated at ~8.83% considering its global revenue exposure, risk-free rate of its currency, and Moody’s credit rating of A2.
- ROIC will be around the ~20% gradually decreasing to its terminal value of ~15%.
💰 Fair Value Estimate
Based on the DCF model, Caterpillar estimated fair value is ~ $329.05, suggesting that currently the stock may be overvalued.
EPS Growth Projections (Weight: 30%)
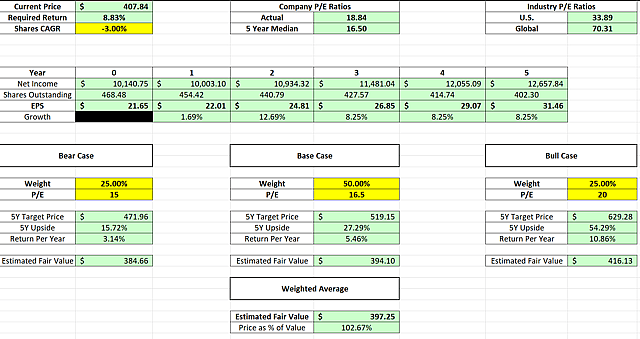
📌 Key Assumptions
- EPS growth projections are estimated using the DCF growth estimates, averaging out about ~8% growth rate.
- Required Return used was ~8.83% based on the calculated WACC used during the DCF valuation.
- The P/E ratios used for the three cenarios were made using the assumption that in a Bear case Caterpillar will still float just a little below its 5-Yr Median at around ~15x, at a Base case it will round to around its history so a ~16.5x and for the Bull case it will be just a little above where it is now at ~20x
💰 Fair Value Estimate
Based on this method, Caterpillar’s estimated fair value is ~ $397.25 suggesting that currently the stock may be trading around its fair value.
Historical P/E Ratio (Weight: 10%)
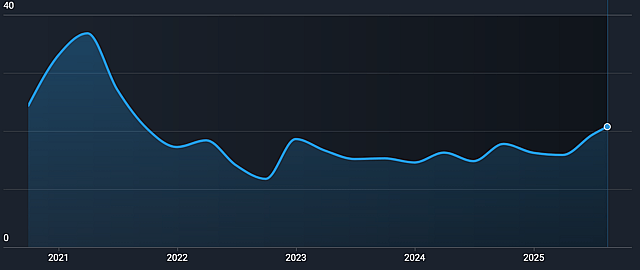
- Current P/E ratio: 18.84x
- 5-Year Median P/E ratio: 16.50x
💰 Fair Value Estimate
This suggests that the stock is trading above its fair value, indicating a potential downside of 12.42% if it reverts back to its historical median.
Using this method, its fair value should be ~ $357.14.
✍️Summary
Averaging the valuation methods by their assigned weights, it’s estimated that the fair value for Caterpillar is $352.32.
Currently the stock appears to be trading above its fair value.